 |
 |
 |
 |


TITLE
|
The Rural Technology Initiative Report to the Washington State Legislature The Washington Log Trucking Industry:
|
Rural Technology Initiative |
Transportation Research Group |
Acknowledgements
This report represents a synthesis of information and analysis provided from many sources. A comparable investigation of the log truck industry has never been undertaken in Washington. The work of the research team included a statewide survey of log trucking firms, review of scientific, government, and industry literature, interviews with government agency personnel, products venders, association representatives, and log truckers. Field visits were taken to log hauling operations. Members of the collaborative research team included Larry Mason, Research Scientist and Project Coordinator of the Rural Technology Initiative (RTI) at the College of Forest Resources (CFR), University of Washington (UW); Dr. Ken Casavant, Professor of Economics at the Transportation Research Group (TRG) School of Economic Sciences (SES), Washington State University (WSU); Bruce Lippke, Economics Professor at CFR UW and Director of RTI; Diem Nguyen, WSU Research Assistant and PhD. candidate; and Dr. Eric Jessup, Assistant Professor of Economics at the TRG SES WSU.
Critically important to the completion of this project were the countless conversations with log truck drivers, association representatives, government agency personnel, products venders and other timber industry professionals that provided information and professional insights regarding the business and safety of log hauling in Washington State.
A list of the most prominent information contributors presented in alphabetical order includes: Jerry Bonagofsky (Washington Contract Loggers Assn), Darin Burt (Log Trucker Magazine), Mike Crouse (Log Trucker Magazine), Jeff Dennis (Jeff Dennis Trucking), Rick Dunning ( Washington Farm Forestry Assn), Jim Dynes (Kibble and Prentice), John Ehrenreich (Washington Forest Protection Assn), Art Farley (Washington Dept of Licensing), Dave Giles (Washington Dept of Transportation), Jon Green (Phelps Tire), Ted Hall (Kenworth NW), Rick Ham (Cummins NW), Wayne Hofer (NC Power Systems), Gary Irwin (Mattei Insurance Services), Craig Iskra (Washington Trucking Associations), Scot Kelsey (Michelin), Jim Murphy (Michelin), Roger Nafts (PacLease Kenworth), Jim Neilson (NW Log Truckers Cooperative), Bill Pickell (Washington Contract Loggers Assn), Dan Ramsey (Kenworth NW), Eddie Rauser (Washington Dept of Labor and Industries), Jonathan Reimer (Oregon Department of Transportation), Ken Rollins (NW Log Truckers Cooperative), Linda Shincke (Washington State Patrol), Doug Smith (Les Schwab), Thomas Smith (Washington Dept of Transportation), Ryan Spencer (Spencer Trucking), Peregrin Spielholz (Washington Dept of Labor and Industries), Bill Street (International Association of Machinists and Aerospace Workers), Pete Strom (Barry Swanson Trucking), Wayne Tuthill (NW Log Truckers Cooperative), Jim Wilhelm (Phelps Tire), Maurice Williamson (Williamson Consulting), Jeff Wimer (Oregon State University), Brett Whitaker (Whit-Log Inc.).
Special thanks are extended to Norm Miller, Director of the Log Truckers Conference of the Washington Truckers Associations, for his invaluable contributions of information and contacts.
This work was made possible by funding provided by and under the mandate of the Washington State Legislature.
Any opinions, findings, conclusions, or recommendations expressed in this publication are those of the authors and do not necessarily reflect the views of the Washington State Legislature or the project cooperators.
Abstract
In 2007, the State Legislature requested scientists from the University of Washington and Washington State University undertake an investigation of the Washington log truck industry towards gaining better understanding of “the costs to safely provide log hauling services.” No such study had previously been conducted in Washington. Deregulation of the trucking industry, rising fuel prices, declining wood markets, shortages of skilled drivers, increases in traffic congestion and other ensuing circumstances have added new operational pressures that could logically have safety implications for this historically dangerous industry. Safe and sustainable log hauling services are needed to support a significant Washington forest industry and to protect the traveling public. Review of the scientific, government, and industry literature was accompanied by interviews with government agency personnel, products venders, association representatives, log truckers, and other industry professionals. Field visits were taken to log hauling operations, a statewide survey of log truck companies in Washington was completed, and a cost of operations model was developed. Cost estimates were developed as baseline required expenses of log truck operation, regardless of company revenues.
From 2006 to 2008, operating expenses rose by 20 percent, largely as a result of increases in diesel fuel prices. For 2008, analysis indicates non-wage cost of operations should average $1.58 to $1.72 per mile. When average wage-related costs are included, total operation expenses can be expected to increase to between $2.46 and $2.98 per mile depending on wage assumptions, provision of overtime, and health insurance benefits. A review of gross revenues as reported by survey respondents reveals that some businesses may be struggling to meet cost of operations. It has been suggested that economic pressures could result in deferred maintenance and increased public safety hazard. No evidence was found to indicate an increase in collisions, injuries, or fatalities associated with log truck operations. By contrast, the accident record for log trucks compares very favorably with that of the broader population of state commercial carriers. However, a number of disturbing concerns were discovered that could challenge future safety performance. The issues of rising cost of operations, extended hours of service, an aging workforce, poor driver recruitment, increasingly congested roadways, and the influx of out-of-state trucks will need periodic review to monitor impacts.
Keywords: Log trucks, log haul, truck cost of operations, truck safety, timber industry, hours of service
Executive Summary
 The Washington forest industry employs 45,000 people and annually generates $2 billion in wages, $16 billion in gross business revenues and over $100 million in tax receipts. Washington produces six billion board feet of lumber per year, one billion square feet of plywood panels, and seven million tons of pulp and paper products. Washington has the second largest lumber production in the nation and is fourth in production of both plywood and pulp and paper products. All of this activity is dependent upon the drivers and trucks that move raw logs from the woods to process facilities.
In 2007, the State Legislature requested that scientists from the University of Washington and Washington State University undertake an investigation of the Washington log truck industry towards gaining better understanding of “the costs to safely provide log hauling services.” No such study had previously been conducted in Washington. Deregulation of the trucking industry, rising fuel prices, declining wood markets, shortages of skilled drivers, increases in traffic congestion and other ensuing circumstances have added new operational pressures that could logically have safety implications for this historically dangerous industry.
A review of scientific, government, and industry literature was accompanied by interviews with government agency personnel, products venders, association representatives, log truckers, and other industry professionals. Field visits were taken to log hauling operations, a statewide survey of log truck companies in Washington was completed, and a cost of operations model was developed.
First, all estimated costs, other than wages, of operating a log truck for a single truck company operating a 1998 tractor and a multiple truck company operating a new tractor, based upon average 2006 fuel prices as reported by trucking survey respondents ($2.74 per gallon) are developed. Second, we present operations costs for both company type examples with a current approximated average fuel price for Washington for June 12, 2008 ($4.91 per gallon). In the period from 2006 to June 2008 the price of diesel fuel had increased by 79%. Two different operational scenarios were developed to show cost differences relative to company size, equipment age, and increases in fuel prices. Cost estimates are to be considered as baseline required expenses of log truck operation regardless of company revenues. Estimates are for average road conditions of 17 percent gravel and 83 percent pavement.
Non-wage cost of operations for single and multiple truck companies; 2006 and 2008
A full accounting of the cost of operations would not be complete without consideration of wages and wage-related costs. Surveyed companies and interviewed truckers were asked about compensation. Log hauling companies in Washington with employed drivers utilize two primary approaches for compensation; some drivers are paid an hourly wage and others are paid on a percentage of the truck daily gross revenue. Analysis of survey response data indicates that truck drivers receive either an average wage of $16.09 per hour or are paid based upon an average of 32.0% of the gross revenue for the truck.
In order to offer a representative range of the full cost of operations of a log truck for each company example as developed for non-wage cost estimates presented above, we provided one low-cost scenario (A) in which we use the suggested hourly wage of $16.09 but consider this as a flat rate in lieu of over-time and do not include health insurance benefits. In the high-cost scenario (B), we model as for more conventional businesses and use the suggested hourly wage for the first 40 hours per week but increase to $24.14 (“time-and-a-half”) for over-time hours in excess of 40 hours per week. For the high-cost scenario, we also include estimated costs of health insurance for driver and spouse. Employee-related costs such as social security, industrial insurance, and drug test charges are also included. Employment benefits such as retirement plans and paid vacations were not included in this analysis but, if provided, would increase costs of benefits.
Cost of operations for single (1A) and multiple (2A) truck companies with wage-related costs excluding overtime and benefits; 2006 and 2008.
Cost of operations for single (1B) and multiple (2B) truck companies with wage-related costs including overtime and health insurance benefits; 2006 and 2008.
Cost of operations compared to average reported gross revenues
The average 2006 gross revenue per truck for a log trucking company in Washington, as reported by 103 survey respondents, was $137,775. A comparison of this gross return to simulations of cost of operations for 2006 suggests that average revenues for log truck companies were marginally equivalent to our lowest estimate of full cost of operations as modeled for the 2006 owner-operator scenario (1A; without overtime or benefits). Analysis of the distribution of survey-reported gross revenues suggests that about half of respondent companies were operating log trucks with revenues below estimated minimum cost of full-time operations. In contrast, less than six percent of survey respondents reported gross earnings that exceeded the simulated 2006 high cost of operations (2B) for a new truck with a driver that received $16.09 per hour with over time and health insurance benefits.
Log truck survey results for 2006 annual gross truck revenues.
Average |
Median |
Min |
Max |
|
| Annual Truck Gross 2006 | $137,775 |
$134,198 |
$42,000 |
$232,910 |
Summary comparison of modeled total annual operation costs and fuel costs for 2006 to 2008. Ranges reflect low (self-employed driver: older truck with no overtime or benefits) to high (employed driver: new truck with overtime and benefits). Base wage = $16.09/hr.
Analysis of accident data provided by the Washington State Patrol and the Washington Department of Transportation for all collisions involving log trucks for years 2002 through 2007 showed no trend of increasing safety hazard to warrant public concern. WA accidents involving log trucks declined by 11% from 2004 to 2006 while collisions of all state commercial carriers increased by 15% during the same period. A review of WA Department of Labor and Industries data for on-the-job injuries and fatalities of log truck drivers also showed no trend indicating increase.
While the accident record of the Washington log trucking industry shows no apparent trends to indicate increased collision, injury, or fatality incidence, this investigation uncovered a number of concerns that could challenge future safety performance and economic viability of log truck operations. Trucking issues such as deregulation, rising cost of operations, extended hours of service, an aging workforce, poor driver recruitment, and increases in roadway congestion have been linked by prior research to declines in the safety performance of commercial carriers. The current influx of out-of-state trucks log trucks providing hauling services within Washington is a new issue with uncertain safety and economic implications. Public health impacts associated with diesel exhaust exposure represent an emerging safety concern with potential to increase cost of operations.
The following information was developed from averaged results of a statewide survey of the log truck industry to which 129 companies operating 336 trucks responded. 64% of respondents reported operation west of the Cascades, 13% east of the Cascades, and 23% operated statewide.
Demographics – The average age of a log trucker is 55 years. The average experience in log truck operation spans 27 years. The majority of log hauling companies (64%) are owner-driver operations with a single truck and trailer. The average company has been in business for 21 years. The average truck is a 1990’s model six-axle “long logger” that can travel about five miles on a gallon of diesel fuel. The average log truck has a gross legal weight limit of 88,000 lbs. with a net payload potential of 58,835 lbs. Logs are hauled an average of 12.2 hrs/day for 5.1 days/wk with 6.8 hrs/wk required for maintenance. The average work week was 69 hours. Three loads of logs are delivered daily. The average one-way distance from point of loading to point of delivery is 67.4 miles of which 17% are traveled on gravel and 83% are traveled on pavement. Logs are hauled 42 wks/yr with 5.7 wks/yr lost to fire season, road closures and other seasonal constraints and 1.7 wks/yr lost for equipment breakdowns. The average log truck driver hauled logs more than 66,000 miles in 2006 and earned $33,404 in personal income.
Safety – Survey respondents overwhelmingly (89%) indicated that traffic and road conditions are considered to be the most dangerous parts of their jobs. Only 11% of drivers felt that the loading and unloading of logs presented the greatest danger. Seventy-six % of respondents felt that Washington paved roadways are in worse condition today as compared to 10 years ago. 99% indicated that traffic is worse today. Respondents report an average of 21.3 stops per year for weight and equipment inspections with each stop lasting 25 minutes. Seventy-five % of respondents report getting voluntary annual equipment inspections for their log trucks with 50% reporting that voluntary inspections help to reduce time lost for road checks. While survey responses suggest that many log truck drivers regularly operate beyond legal hours of service, no evidence was found to indicate that such practice resulted in unsafe log truck operation.
Implications for the future – Eighty-seven % of respondents report that it is very difficult to find and keep skilled truck drivers and 99% report that skilled drivers are harder to find today than 10 years ago. An analysis of WA Department of Licensing data revealed that the number of log trucks registered in Washington has declined by 36% from 2059 trucks in 1998 to 1325 trucks in 2006. Survey responses (2006) show 28% of log hauling companies lost money, 50% broke even, and 21% reported making a profit. By 2008, the price of fuel had increased by 79% and the total cost of operations increased by 20%. Thirty-five % of respondents reported plans to make equipment purchases within the next five years, while 65% indicated that no investment was anticipated. Thirty-eight % of respondents reported plans to retire or otherwise leave the industry, 36% reported plans to stay the same, 13% expected to diversify to other trucking industry, 12% intend to downsize, and 1% plan to expand hauling operations. When asked to rate the business environment in Washington for the log hauling industry, 83% of respondents reported poor, 17% said average, and 0% selected good.
Summary comments and recommendations
Log trucking in Washington has always been a uniquely independent and small-operator-dominated industry. In the early years when contract “gyppo” truckers were first displacing the railroads as the main form of wood transport, there were no standardized haul rates or safety practices. By the late 1930’s, however, state trucking regulations were being established. For decades the relationships between cost of operation and revenue per unit output were effectively stabilized by state regulations that controlled entry, set haul rates, and established safety standards. However, since 1995 and federal deregulation of the trucking industry, this has no longer been the case. This investigation found evidence of highly variable current haul rate arrangements that have resulted in many companies operating below cost of operations. Constrained revenues to log trucking companies come at a time of unprecedented fuel price increases with unstable economics contributing to declines in the number of Washington log truck companies and an inability of the industry to recruit young drivers. While our analysis of accident records reveals that, in spite of economic challenges, the log hauling industry is comparatively safe relative to the performance of the broader population of commercial carriers, safety does not translate to economic viability. There is ample evidence to suggest that the sustainability of log trucking businesses is in question and such uncertainty is a legitimate matter for private and public concern. Economic viability comes from the actual relationship between private cost of operation and revenue to the trucking firm. We hope that the results of this investigation will prove useful to both buyers and sellers of hauling services by helping to inform contract discussions. Survey results indicate that many log truckers would like to see re-imposition of state-regulated haul rates. A review of the relevant laws leads to a conclusion that federal deregulation of trucking precludes such possibility. However, our investigation has identified two potential state legislative opportunities to provide relief for log trucking companies that may be worthy of consideration.
Business and Occupation Taxes- The Washington Business and Occupation Tax (B&O Tax) is calculated at 1.926 percent of gross revenues. Depending upon costs simulation scenario, we estimate that B&O Taxes will add $3,072 to $4,012 to cost of operations for log hauling companies in 2008. B&O Taxes associated with fuel and wages account for 70% to 79% of the total B&O Tax responsibility. From 2006 to 2008, although loads of logs hauled remained constant, the B&O Tax payment, for log trucking companies, increased by about 20 percent. B&O Taxes add to cost burdens for log hauling businesses with fixed levels of productivity that struggle to accommodate increasing fuel and wage-related costs. B&O Taxes, as currently levied, affect employees by lowering company profitability and serving as a disincentive for employers to provide better wages and benefits. Relief from B&O Taxes could be helpful to many Washington businesses but would be especially beneficial to fuel-intensive transportation industries.
Equipment options to reduce costs and increase safety - Great strides in emissions reduction equipment development have been made by manufacturers but acceptance and investment lag potential. Heavy trucks of 2007 vintage or newer are equipped with exhaust systems that allow very low emissions of fine particulates and other pollutants. This is not the case for older trucks. Since diesel engines can provide a million miles or more of service it could take decades to significantly reduce the adverse effects of diesel exhaust in Washington. Retrofit of diesel particulate filters that are designed to cut soot emissions by 90 percent can be accomplished for trucks 1990 and newer. However, the cost of retrofit is estimated at $7,000 to $10,000 per truck. Both the Governor and the Legislature have identified pollution reduction as an important state objective to improve human health and to control emissions of green house gasses. The Washington Department of Ecology estimates a public benefit of three to sixteen dollars from every dollar invested in reducing diesel pollution. It appears that trucking companies, such as log haulers, may not be able to afford such investment without assistance.
Equipment upgrades to heavy trucks for reduced pollution are not limited to exhaust systems. We identified central tire inflation systems and “super-single” tires as low-cost opportunities where investments in equipment upgrades could reduce fuel consumption by upwards of five percent, on any age of truck. Achievement of reductions in fuel consumption automatically results in avoided emissions and can also provide economic relief to trucking companies. States such as California have recognized that public expenditures through grants and tax incentives for “green” equipment upgrades for heavy trucks are prudent public investment in climate change mitigation. State programs for investment to support equipment upgrades that reduce fuel consumption and pollution could help trucking companies reduce fuel costs and provide significant public environmental benefit.
Future research - A significant change for the log truck industry occurred when intrastate trucking was deregulated by the United States Congress. There is broad disagreement within the trucking literature as to the costs and benefits of deregulation. Other regulatory discussions, as yet unresolved, that could affect log trucking relate to increases to gross weight limits and whether current disparate state rules should be replaced with uniform federal standards. As state and federal regulatory authorities evolve through time, the implications for a safe and sustainable log truck industry will merit periodic evaluation.
Little data were found available with which to develop trend analysis for the log hauling industry. Lack of data challenges scientific research and hinders informed policy-making. Many factors uncovered by this investigation suggest that the log trucking industry could experience dramatic changes in the future. Issues such as revenue shortfalls, rising costs of operation, extended hours of service, an aging workforce, poor driver recruitment, increasingly congested roadways, shifting regulations, and growing public concern about pollution have been highlighted by this investigation. The interconnectivity of these issues should be a research focus as policy solutions are crafted for the future.
Table of Contents
Here is a link to view or download a pdf copy of the entire report:
The Washington Log Trucking Industry: Costs and Safety Analysis
Acknowledgements
Abstract
Executive summary
Cost of operations
Cost of operations compared to average reported gross revenues
Safety
Survey results
Summary comments and recommendations
Section I: Background
History
Truck and trailer equipment and operation
Regulation of truck rates
Study methods
Section II: Operating costs
Non-wage cost of operations
Non-wage cost of operations for a company with a single log truck
Non-wage cost of operations of a log truck by a multi-truck company
Results and discussion; Simulations of non-wage operational costs
Operating cost simulations with wages considered
Total cost of operations for a company with a single log truck
Total cost of operations for a multi-truck company
Results and discussion; Simulations of full cost of operations
Implications of business and occupation taxes
Analysis summary and conclusion – Total costs of operating a log truck
Section III: Safety
Basis of concern
Current safety status of the log truck industry
Issues for concern
Safety summary
Section IV: Results and conclusions
Summary of survey results
Application of economic findings
Conclusions and recommendations
References
Appendix A: Log Truck Configurations
Appendix B: Log Truck Survey Questionnaire
Appendix C: Wooden Roads
Appendix D: Placement and Number of Wrappers
Appendix E: Log Road Classifications
Appendix F: Recognition of Voluntary Truck Inspection Program Success
List of Figure
| Figure 1.1. Early truck hauling split spruce log on a fore and aft plank road on the Olympic Peninsula |
| Figure 1.2. Early loggers hauling peeler blocks with a Kelley-Springfield truck on a cross-plank road |
| Figure 1.3. Mack truck with flange wheels on fore and aft pole road |
| Figure 1.4. By the 1950s, the remaining railroads were few and trucks dominated log transport in the Pacific Northwest |
| Figure 1.5. Contemporary 5-Axle log truck |
| Figure 1.6. A double trailer short logger or mule train getting loaded |
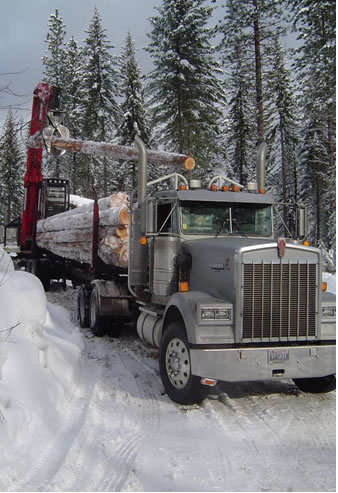
| Figure 2.1. Six-axle long-logger; mounted trailer |
| Figure 2.2. Diesel fuel prices 1994 to 2008 (EIA) |
| Figure 2.3. Six-axle log truck; loading at the landing |
| Figure 2.4. Six-axle long-logger; unloading at the dump |
| Figure 2.5. 2006 gross revenue per truck as reported by respondent log truck companies |
| Figure 3.1. Overturned log truck |
| Figure 3.2. Washington log truck accidents 2002-2007 |
| Figure 3.3. Defective equipment and fatigue; causes of log truck accidents 2002-2007 |
| Figure 3.4. Fatality and injury collisions involving log trucks 2002-2007 |
| Figure 3.5. Log trucker fatalities as reported to L&I for years 1998-2007 |
| Figure 3.6. Log truck driver L&I claims per 100 FTE 1997-2005 |
| Figure 3.7. Trucking sectors compete for drivers |
| Figure 3.8. Increases to WA population and annual VMT |
| Figure 3.9. Log Truck Survey Question 65b |
| Figure 3.10. WA log truck accidents by roadway type 2002-2007 |
| Figure 3.11. Surveyed log truck model year distribution |
| Figure 3.12. Hours of maintenance verses truck age |
| Figure 3.13. Annual gross revenue verses truck age |
| Figure 3.14. Annual trucker income verses truck age |
| Figure 3.15. Historical Trend in Emissions from New Diesel Engines |
| Figure 3.16. Heavy duty truck engines sold in western Washington and Alaska from 1994 through 2007 |
| Figure 3.17. Voluntary Safety Inspection; Log Truckers Conference of the Washington Trucking Associations |
| Figure 4.1. Annual 2006 gross revenue per truck for respondent log hauling companies........ |
| Figure 4.2. Washington Log Truck Accidents 2002-2007 |
| Figure 4.3. Log trucks registered for operation in Washington verses log trucks registered in Oregon to operate in Washington |
| Figure 4.4. Increases to WA population and annual vehicle miles traveled (VMT) |
| Figure 4.5. 1940 Mack log truck |
List of Tables
| Table 2.1. Demographic and performance averages for single-truck companies |
| Table 2.2. Summary of fixed costs for single-truck companies |
| Table 2.3. Summary of variable costs for single-truck companies |
| Table 2.4. Summary of comparative fuel costs 2006-2008 |
| Table 2.5. 2006 Cost of Operations for a Company with a Single Log Truck. (Without wage-related costs) |
| Table 2.6. 2008 Cost of Operations for a Company with a Single Log Truck. (Without wage-related costs) |
| Table 2.7. Demographic and performance averages for multi-truck companies |
| Table 2.8. Summary of fixed costs for multi-truck companies |
| Table 2.9. Log truck survey question 29: If you are an employer, how difficult is it to find and keep skilled truck drivers? |
| Table 2.10. Log truck survey question 30: How available are skilled truck drivers today as compared to 10 years ago? |
| Table 2.11. Summary of variable costs for multi-truck companies |
| Table 2.12. Summary of comparative fuel costs 2006-2008 |
| Table 2.13. 2006 Cost of Operations for a Multi-Truck Company. (Without wage-related costs) |
| Table 2.14. 2008 Cost of Operations for a Multi-Truck Company. (Without wage-related costs) |
| Table 2.15. Summary of non-wage single-truck operations cost |
| Table 2.16. Summary of non-wage multiple truck operations cost |
| Table 2.17. Non-wage costs comparisons: single and multiple truck companies |
| Table 2.18. Percent difference cost/performance comparisons |
| Table 2.19. Average 2007 hourly wages for selected occupations as reported by USBLS |
| Table 2.20. Average driver compensation alternatives indicated by survey respondents |
| Table 2.21. Log truck survey question 22: Do you know what you will be paid prior to beginning a new haul from a logging site? |
| Table 2.22. Log truck survey question 23: How long from the time of haul until you are paid? |
| Table 2.23 1A - 2006 Cost of Operations for a Company with a Single Log Truck. (With wage-related costs excluding overtime and health insurance benefits) |
| Table 2.24. 1A - 2008 Cost of Operations for a Company with a Single Log Truck. (With wage-related costs excluding overtime and health insurance benefits |
| Table 2.25. 1B - 2006 Cost of Operations for a Company with a Single Log Truck. (With wage-related costs including overtime and health insurance benefits) |
| Table 2.26. 1B - 2008 Cost of Operations for a Company with a Single Log Truck. (With wage-related costs including overtime and health insurance benefits) |
| Table 2.27. 2A - 2006 Cost of Operations for a Multi-Truck Company. (With wage-related costs excluding overtime or insurance benefits) |
| Table 2.28. 2A - 2008 Cost of Operations for a Multi-Truck Company. (With wage-related costs excluding overtime or insurance benefits) |
| Table 2.29. 2B - 2006 Cost of Operations for a Multi-Truck Company. (With wage-related costs including overtime or insurance benefits) |
| Table 2.30. 2B - 2008 Cost of Operations for a Multi-Truck Company. (With wage-related costs including overtime or insurance benefits) |
| Table 2.31. Summary of single-truck operation costs without overtime and benefits (1A) |
| Table 2.32. Summary of single-truck operation costs with overtime and benefits (1B) |
| Table 2.33. Comparison of $16.09 per hour and 32.0% of total truck costs as a determiner of annual wage for a single-truck operation in years 2006 and 2008 |
| Table 2.34. Summary of multi-truck company operation costs without overtime and benefits (2A) |
| Table 2.35. Summary of multi-truck company operation costs with overtime and benefits (2B) |
| Table 2.36. Comparison of $16.09 per hour and 32.0% of total truck costs as a determiner of annual wage for a fleet driver of a new long-logger in years 2006 and 2008 |
| Table 2.37. B&O Tax implications for the single-truck company from Scenarios 1A and 1B; 2006-2008 |
| Table 2.38. B&O Tax implications for the multi-truck company from Scenarios 2A and 2B; 2006-2008 |
| Table 2.39. Fixed, variable, wage and non-wage, and total cost of operations for miles, tons, and hours for scenarios 1A and 2A (without overtime and benefits) |
| Table 2.40. Fixed, variable, wage and non-wage, and total cost of operations for miles, tons, and hours for scenarios 1B and 2B (with overtime and benefits) |
| Table 2.41. Log truck survey results for 2006 gross return |
| Table 2.42. Modeled annual cost of operations and fuel costs for 2006 to 2008 |
| Table 2.43. 2008 estimated total cost of operations |
| Table 3.1. Log truck survey question 15: How many hours per day per truck do you and/or your drivers normally work? |
| Table 3.2. Log truck survey question 16: How many days per week per truck do you and/or your drivers normally work? |
| Table 3.3. Log truck survey question 17: How many hours per week are normally required for maintenance of your log truck? |
| Table 3.4. Log truck survey question 14: How many loads per day per truck do you and/or your drivers normally haul? |
| Table 3.5. Log truck survey question 13: What is your average one-way haul distance? |
| Table 3.6. Log truck survey respondent age distribution |
| Table 3.7. Log truck survey question 65a: What do you feel is the most dangerous part of your job as a log truck driver? |
| Table 3.8. Stopping distances for cars versus trucks |
| Table 3.9. Log truck survey question 40: How would compare the traffic on Washington paved roads today as compared to 10 years ago? |
| Table 3.10. Log truck survey question 39: How would you compare the quality of Washington paved roads today as compared to 10 years ago? |
| Table 3.11. Log truck survey question 41: How would you compare the quality of Washington gravel roads today as compared to 10 years ago? |
| Table 3.12. Log truck survey question 50 |
| Table 4.1. Firm size and ownership types |
| Table 4.2. Driver characteristics |
| Table 4.3. Truck makes, quantities, percentages, and average ages |
| Table 4.4. Truck age and associated variables |
| Table 4.5. Truck age and associated variables (continued) |
| Table 4.6. Truck configurations |
| Table 4.7. Profitability reporting from respondents |
| Table 4.8. Future Plans of respondents |
| Table 4.9. Log truck company demographics by county |
| Table 4.10. Haul distances (landing to dump) and road quality by county |
| Table 4.11. Loads per day, workdays per week, and maintenance hours per week by county |
| Table 4.12. Pay wait in weeks and gross return metrics by county |
| Table 4.13. Insurance, tires, and utility costs per year and total value of current equipment investment by county |
| Table 4.14. Diesel statistics for 2006 by county |
| Table 4.15. How are you responding to rising fuel prices? |
| Table 4.16. How would you rate the business environment in Washington for the log hauling industry? |
| Table 4.17. What do you feel could be done at the state level to improve your business competitiveness? |
| Table 4.18. What do you feel is the most dangerous part of your job as a log truck driver? |
| Table 4.19. How would compare the traffic on Washington paved roads today as compared to 10 years ago? |
| Table 4.20. How would you compare the quality of Washington gravel roads today as compared to 10 years ago? |
| Table 4.21. Log truck survey results for 2006 gross return |
| Table 4.22. Log truck survey results for 2006 net income |
| Table 4.23. Non-wage cost of operations for single and multiple truck companies |
| Table 4.24. Cost of operations for single (1A) and multiple (2A) truck companies with wage-related costs excluding overtime and benefits |
| Table 4.25. Cost of operations for single (1B) and multiple (2B) truck companies with wage-related costs including overtime and health insurance benefits |
| Table 4.26. Log truck survey results for 2006 annual gross truck revenues |
| Table 4.27. Summary comparison of modeled total annual operation costs and fuel costs for 2006 to 2008 |

