 |
 |
 |
 |


The Washington Log Trucking Industry:
Costs and Safety Analysis
Section II: Operating Costs
Non-Wage Cost of operations Washington Log Truck IndustryAn interactive cost accounting model was constructed to simulate a range of log truck operation costs for two example scenarios; 1) companies with self-employed single-truck operations with older equipment and 2) companies with new equipment that employ drivers to operate multiple trucks. Using these examples, a comparison of the fuel (diesel) price increases from 2006 to 2008 was developed with most other operational costs remaining constant for each scenario. Operation cost estimates were developed from information provided by state agencies, products venders, available literature, and the Washington Trucking Association in combination with the specific survey response data collected from the log truck industry. Cost estimates were initially developed as baseline required expenses regardless of company revenues. First, we present all estimated costs, other than wages, of operating a log truck for both small and larger companies based upon average 2006 fuel prices as reported by trucking survey respondents ($2.74 per gallon). Second, we present operations costs with a current approximated average fuel price for Washington as calculated with June 12, 2008 data taken from the American Automobile Association Daily Fuel Gauge web site ($4.91 per gallon) (AAA 2008). In the period from 2006 to June 2008 the price of diesel fuel has increased by 79%. Two different operational scenarios are offered to show cost differences relative to company size, equipment age, and impact of increases in fuel prices. Costs of operating a log truck are presented under two general accounting/economic categories; fixed and variable costs. Fixed costs are incurred whether the truck operates or not and do not vary with the level of output, e.g. miles or hours of operation. For most companies, the dominant fixed costs are truck and insurance payments. The more logs that are hauled the more that fixed costs are reduced as measured by dollars per unit output. Variable costs are expenses that are directly related to the operation of the log truck. Variable costs of truck operation are dominated by fuel, repairs, and wages. These are costs that increase with levels of hauling activity. Some operation expenses, such as utilities and administration, may actually function as mixed costs that are fixed but may change with thresholds of activity. For simplicity, the following analysis considers all costs as either fixed or variable.
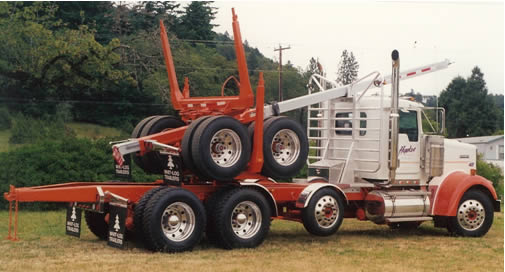
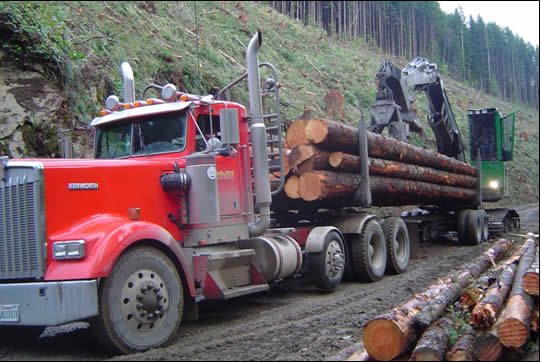
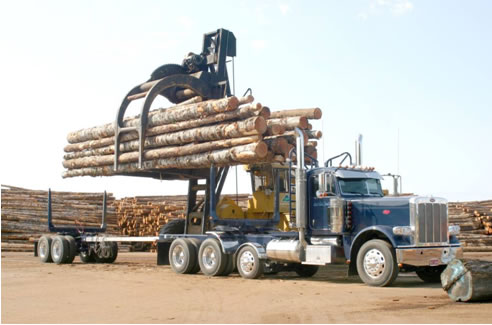
While there are varied truck and trailer configurations employed by log hauling companies (For images of the variety of log truck configurations currently in use see Appendix A), the most common in Washington is a six-axle long-logger (Figure 2.1 above), therefore, all cost simulations presented in the following pages are based upon this model. A long-logger is designed to haul long logs generally forty feet in length. The popularity of the long-logger results from timber purchaser preferences for long-length logs. Many log purchase orders require length averages in excess of thirty feet with the price of shorter logs discounted. Other configurations are known to have somewhat different cost factors but are too many and varied to present in this report. It was our intent, therefore, to select the most representative truck type and to suggest that the relative differences demonstrated by cost simulation alternatives are consistent for other truck types.
Non-Wage Cost of operations for a Company with a Single Log TruckOf the 129 companies that responded to our survey, 83 (64%) were single-truck companies. The average company owner was 55 years of age. The median year of manufacture for trucks operated in this industry subset was 1998. Consequently the sample truck, selected for cost simulations, was a 1998 six-axle long-logger with gross weight 88,000 lbs. and an average net payload weight of 58,835 lbs. (29.4 tons), based on survey results. Survey analysis further indicated that in 2006, single-truck companies operated an average of 43.4 weeks per year, delivering logs 5.1 days per week and 12.4 hours per day. An additional 7.1 hours for maintenance were required each week. Fuel consumption averaged 5.1 miles per gallon. Average miles driven were 66,122 per year with approximately 17% on gravel roads and 83% on paved roads. 17,336 tons of logs on average were hauled on each truck in 2006. Survey analysis showed an average of 589.3 loads per year per truck with 112.2 round-trip miles per load, or an average of 56.1 miles from the point of loading (“the landing”) to the point of unloading (“the drop”).
Fixed costs for a company with a single log truck For reference, we begin with an estimate of the average cost of a new truck, as suggested by survey respondents, which was found to be $122,991. The average cost of a new trailer was indicated by respondents to be $31,909. Since there are many customized variations on new truck orders that can greatly influence sticker price, we assume that estimated prices of new equipment are a reliable consensus surrogate for average new equipment cost. This assumption was confirmed as reasonable by the Washington Trucking Association (Miller 2008). It is apparent, however, from survey response data that single–truck companies may not generally operate new trucks. The median year of manufacture for trucks operated by these companies was 1998. Consequently, a six-axle long-logger of this age was selected as representative of the equipment preference. Based upon review of used equipment sales advertisements, we estimated that a 1998 log truck can be purchased at a price of $30,000, which is approximately 25% of the cost of a new truck. A used trailer can be purchased for $15,000, or approximately 50% of the new cost of a trailer. Total purchase price for used equipment needed to haul logs was therefore estimated to be $45,000. This estimated representative cost of log hauling equipment was confirmed as reasonable by the Washington Trucking Association (Miller 2008). For simulation purposes, we assumed that this equipment was purchased with financed funds, kept for seven years, and then replaced. Following seven years, the truck and trailer are seventeen years old but do retain some salvage value. We calculated the salvage value at $9,000, which is 20% of the initial truck and trailer purchase price. The present value of the salvage recovery, calculated to be $4,923, was deducted from the purchase price, which leaves a net cost of $40,077 for the truck and trailer. In addition to the purchase price, there is an 8% sales tax of $3,600 on this vehicle purchase. The total purchase cost to be financed was therefore $43,677, which was to be paid over seven years at an interest rate of 9% as suggested by the Kenworth Sales Department as an approximate current average rate for equipment finance (Hall 2008). Depreciation is considered to be equally distributed over the seven-year period. The first fixed cost is then a payment obligation of $8,432.61 per year for seven years ($702.72 per month for 84 months). Truck insurance estimates (collision, liability, and property damage) were sought from insurance companies but were not made available due to proprietary concerns and risk rate variability for customers. The Mattei Insurance Services Company and the Washington Contract Loggers Association both provide insurance for many log truck companies. Representatives from both organizations agreed that, while insurance rates are highly variable by customer, log truck insurance rates have stayed flat or even declined in recent years due to competition amongst underwriters and lack of change in risk rating for the insured (Irwin 2008, Bonagofski 2008). Survey response analysis indicated that the average truck insurance cost for companies operating a 1998 long-logger in 2006 was $3,971 per year. The Washington Trucking Association confirmed that this is a reasonable average insurance estimate for this application (Miller 2008). License fees for a six-axle long-logger are $2,225 per year if trucks are registered as instate log haulers under Schedule A (RCW 46.16.070). An additional annual fee of $90 is charged for trucks that are registered under Schedule B for combination use and travel outside Washington State. In 2006, 68% of log trucks in Washington were registered as Schedule A (WSDOT, WSDOL 2007). Survey findings provided close agreement to this statistic; indicating that 62% of respondent trucks are registered as schedule A. Consequently, the Schedule A license fee is the rate that was used for the cost analysis. Parking and shop costs were estimated to be $1200 per year ($100 per month), based on survey results. Administration costs were approximated at $2,213 per year (average $10 per day and 221.3 days of operation per year in 2006 as indicated by survey results). Utilities needed for truck operations include phone, heat, and electricity. An estimated annual utility cost of $1,355 was the average reported by survey respondents. Note that while administration and utilities may correctly be regarded as mixed costs for some accounting applications, for simplicity of presentation these expenses are held constant as fixed costs with no significant compromise to analysis results.
Variable costs for a company with a single log truck Variable cost factors were developed based upon interviews with truckers, venders, and association representatives, response data from the log truck survey, and information from the Washington Department of Revenue (WSDOR 2008). Many variable costs were found to be related to proper practices of equipment maintenance with schedule and expense more or less standard throughout the industry, regardless of the age of equipment. Variable maintenance expenses are held constant for cost simulations. Oil changes were estimated to occur every 6 weeks or 10,000 miles at a cost of $175 per change, including labor, filters, and oil (6 gallons @ $7.00/gallon). Lubrication and maintenance was scheduled for once a month and was assigned a cost of $240 to include 3 to 4 hours of shop time plus materials. Replacement of miscellaneous hoses, lights, and other minor parts associated with normal truck wear was expected to cost $25 per week. Average brake replacement for all wheels was considered to occur once a year, at a cost for parts, machine services, and labor of $600. The use of new tires is required by law for steering axles but retreads may be used for the drive and trailer axles. Subject to driver preference, sound steering axle tire casings may be given new tread and re-used as tire replacements elsewhere on the truck. Tire dealers report that the cost of new drive and steer tires has increased marginally by 14% (1.3% per year) and 5% (0.5% per year) respectively over the eleven-year period from 1998 to 2008. This low new tire price increase is credited to the emergence of China as the world’s largest tire manufacturer. Retreads, however, have increased by 31% (2.8% per year) during the same period (Smith 2008, Kelsey and Murphy 2008). New log truck tires cost between $300 and $500 each depending upon manufacturer and profile. A retread tire for a log truck can be purchased for $100 to $200. There are twenty tires on a six-axle long-logger. Based upon the estimated average annual tire replacement costs as reported by survey respondents, tire costs are calculated at $6,371 per year for 2006 and $6,562 per year for 2008 (2008 tire cost reflects average 1.5% per year tire price increase).
Older trucks, such as the 1998 model assumed for this cost simulation, require periodic replacement of major components. While expenses for such repairs may differ dramatically by year and company, we, based on survey responses, estimated that, during the seven-year period of ownership for the simulation, repairs average $5000 per year. Miscellaneous expenses to cover lodging, meals, association dues, truck washes, citations, and other incidental costs of operations were estimated to average $2000 per year. Variable costs other than fuel and tires were held constant for 2006 and 2008 cost comparisons. Business and Occupation Tax for log truckers is charged by the State of Washington against gross revenue at a rate 1.926%. Fuel costs in recent years have been an especially challenging and variable expense for log truck operators, as it has for all truckers. Impacts of changing fuel prices are two-fold: the average rise in cost has been dramatic and the variability in cost has been rapid, extreme, and unpredictable. The impacts of price variability are difficult to simulate as changes occur in short time-frames and revenue responses for adjustment must be customized by individual business relationships. A comparison, however, of the impact of the increase in fuel price from 2006 to 2008, and its impact on per mile costs is presented in the following cost simulations. The average diesel price for 2006 was reported by survey respondents to be $2.74 per gallon. The Washington State average diesel price on June 12, 2008 was estimated to be $4.91 per gallon (AAA 2008). These figures indicate a 79% increase in diesel fuel price from 2006 to 2008 and a corresponding percentage increase in the fuel/cost per mile.
Table 2.5. 2006 Cost of Operations for a Company with a Single Log Truck. Table 2.6. 2008 Cost of Operations for a Company with a Single Log Truck.
Non-Wage Cost of operations of a Log Truck by a Multi-Truck CompanyOf the 129 companies that responded to our survey, 46 companies (36%) reported operation of more than one truck. These companies operated a total of 253 trucks of which 222 were log trucks, representing 73% of all log trucks surveyed. To demonstrate cost differences for multi-truck verses the single-truck operations, we simulated a company adequately capitalized to purchase new log trucks every seven years on a staggered rotation with a fleet of 10 trucks in continuous operation. The example truck for cost simulation purposes was held as a six-axle long-logger with gross weight 88,000 lbs. and net payload weight of 58,835 (29.4 tons). For this simulation, cost analysis was based upon the purchase price of a new 2008 model. A 2008 log truck was certainly not in use in 2006 but, for analysis to examine the impacts of increases in fuel prices, the estimated cost of the 2008 truck was used as a surrogate cost of a new truck in 2006. Seventy eight companies, operating newer log trucks (2001-2008), reported that their trucks hauled logs in 2006 for an average of 45.7 weeks per year, 5.1 days per week and 12.3 hours per day. An additional 6.4 hours for maintenance were required each week. The average miles driven were 71,202 per year. 16,036 tons of logs on average were hauled in 2006 for an average of 545.1 loads per year with 130.6 average round-trip miles per load indicating 65.3 average miles from landing to drop. Consistent for the industry, these truckers also reported that 17% of miles are traveled on gravel roads and 83% on paved roads, fuel consumption was 5.1 miles per gallon, and average owner age is 55 years.
Fixed costs for a multi-truck company The average cost of a new truck, as suggested by survey respondents, was estimated to be approximately $122,991. The average cost of a new trailer was indicated by respondents to be $31,909. The average price of new equipment as suggested by respondents is a reliable consensus surrogate for average new equipment cost. This assumption was confirmed as reasonable by the Washington Trucking Association (Miller 2008). For this simulation, a 2008 log truck is purchased at a new price of $122,991. Interviews with truckers suggest that a new trailer is infrequently purchased as, with proper care and maintenance, log trailers have a longer useful life than the tractors that haul them. To simulate these circumstances in our cost analysis we determined, as in the previous example, that a used trailer could be purchased for $15,000, or approximately 50% of the new cost of a trailer. Total purchase price for a new truck and used trailer needed to haul logs was therefore determined to be $138,946. As above, this equipment is purchased with financed funds, kept for seven years, and then replaced. Following seven years of use, the truck and trailer do retain some salvage value. The estimated salvage value was $55,397 which is 40% of the initial truck and trailer purchase price. The present value of the salvage recovery was calculated to be $30,304 and was deducted from the purchase price, leaving a net cost of $108,188 for the truck and trailer. In addition to the purchase price, there is an 8% sales tax of $11,079. The total purchase cost to be financed was therefore estimated to be $119,267 which was paid over seven years at an interest rate of 9%. Depreciation is considered to be equally distributed over the seven-year period. The first fixed cost established for this simulation is an annual payment obligation of $23,027 for seven years ($1919 per month for 84 months). Survey response analysis indicated that the average insurance cost (collision, liability, and property damage) for companies operating a 2001-2008 long logger was $4,643 per truck per year ($672 per year greater than for the single-truck company with older equipment). The Washington Trucking Association confirmed that this is a reasonable average insurance estimate for this application (Miller 2008). License fees for a six-axle long logger registered for Schedule A use are $2,225 per year. Parking and shop costs were kept constant at $1200 per year ($100 per month) as were utilities at $1355 per year. Administration costs per day were doubled, as compared with single-truck companies, to reflect an increased cost of accounting, scheduling, dispatch, and other activities required to operate 10 trucks. We estimated administration costs to average $4,644 per year per truck (average $20 per day and 232.2 days of operation per year).
Variable costs for a multi-truck company Many variable costs relate to proper practices of equipment maintenance with schedule and expense more or less standard throughout the industry regardless of the age of equipment. For simplicity, variable maintenance expenses were held constant for cost simulations. Oil changes were estimated to occur every 6 weeks or 10,000 miles at cost of $175 per change, which includes labor, filters, oil (6 gallons @ $7.00/gallon). Lubrication and maintenance was scheduled for once a month and assigned a cost of $240 to include 3 to 4 hours of shop time plus materials. Replacement of miscellaneous hoses, lights, and other minor parts associated with normal truck wear was expected to cost $25 per week. Average brake replacement for all wheels was considered to occur once a year at a cost for parts, machine services, and labor of $600. Based upon the estimated average annual tire replacement costs as reported by survey respondents and tire venders, tire costs were calculated at $6,371 per year for 2006 and then increased to $6562 per year for 2008. There are many reasons why, if affordable, new equipment is more desirable than old. One reason is driver recruitment. When survey respondents were asked how difficult it is to find and keep skilled drivers; 87% indicated very difficult, 8% indicated occasionally difficult, and 5% indicated that drivers were readily available. When asked if skilled drivers are harder to find today than 10 years ago; 99% of respondents indicated harder to find, 1% indicated the same, and zero indicated easier to find. In an industry, such as log hauling where employee recruitment and retention can be difficult, a number of truck company owners have told us that operation of newer, more reliable, and comfortable equipment can help to attract and retain the most skilled help. Also important to company owners is the reliability, low maintenance cost, and warranty benefits associated with new trucks. To model the comparative benefit of new truck purchase, we made the conservative assumption that new trucks should not require significant repair beyond normal maintenance. Miscellaneous expenses to cover lodging, meals, association dues, truck washes, citations, and other incidental cost of operations were estimated to average $2000 per year. Variable costs other than fuel and tires are held constant for 2006 and 2008 cost comparisons. Business and Occupation Tax for log truckers is charged by the State of Washington against gross revenue at a rate 1.926%. Table 2.9. Log truck survey question 29: “If you are an employer, how difficult is it to find and keep skilled truck drivers?”
Table 2.10. Log truck survey question 30: “How available are skilled truck drivers today as compared to 10 years ago?”
The average diesel price for 2006 was reported by survey respondents to be $2.74 per gallon. As previously cited, the State average diesel price on June 12, 2008 was estimated to be $4.91 per gallon. These figures indicate a 79% increase in fuel price from 2006 to 2008.
Table 2.13. 2006 Cost of Operations for a Multi-Truck Company. Table 2.14. 2008 Cost of Operations for a Multi-Truck Company.
Results and Discussion - Simulations of non-wage operational costsNon-wage operation costs analysis for a 1998 six-axle long-logger by an owner-operator company with a single log truck – 2006 & 2008 compared Costs per mile, per ton, and per hour can be calculated from total cost of operations based upon performance averages presented in Table 2.1. Our estimated total non-wage cost of operations for a 1998 six-axle long-logger in 2006 was approximately $1.14 per mile. By June 2008, this cost had increased to $1.58 per mile, due primarily to the increase in fuel costs. The average cost per ton in 2006 was $4.37. The average cost per ton in June 2008 was $6.03. The average cost per hour in 2006 was $24.75 while in June 2008 the average cost per hour was $34.19. Findings indicate an increase in non-wage operations cost from 2006 to 2008 of 38.1%.
Non-wage operation costs analysis for a new six-axle long-logger by a company that operates a fleet of ten trucks – 2006 & 2008 compared Costs per mile, per ton, and per hour can be calculated from total cost of operations based upon performance averages presented in Table 2.7. Our estimated average total non-wage cost of operations for a new six-axle long-logger by a fleet in 2006 was $1.28 per mile. By June 2008, this cost had increased to $1.72 per mile, due primarily to the increase in fuel costs. The average cost per ton in 2006 was $5.70. The average cost per ton in June 2008 was $7.64. The average cost per hour in 2006 was $28.98 while in June 2008 the average cost per hour was $38.84. Findings indicate an increase in non-wage operations cost from 2006 to 2008 of 34.0%.
Non-Wage Cost of operations; Simulation Comparisons The results of non-wage operations costs simulations presented above indicated that both small and larger companies have experienced dramatic increases in operating costs due mainly to the rising price of diesel fuel in the two-year period from 2006 to 2008. Based upon the cost analysis results, we found that the change in the price of diesel fuel from 2006 to 2008 resulted in an operating expense increase of approximately $30,000 per year for each truck.
Results suggested that owner-operators using older equipment may be able to deliver logs at a lower cost of operations as compared to newer truck fleet operations. Comparisons, however, are clouded by several factors. Tax benefits derived from new truck purchases are beyond the scope of this investigation and have not been considered. Repair expenses for older trucks are averaged and may be understated. Operational differences in traffic congestion and haul distances may not be adequately considered. Simulations are based on performance metrics of hours per day, weeks per year, miles per year, and tons per year for theoretical company types that were derived from analysis of survey respondent information. In part, this approach was employed to see if down time associated with older truck operation and assumed repair costs ($5000 per year) would result in reduced performance that offset savings from lower purchase cost of an older truck. In fact, it is apparent from survey data that older trucks may work less days per year and require more hours of maintenance. However, for the sample simulation, operation costs per unit of output were higher for new truck companies. For further comparison, we present the tables below. On the left are the percentage differences when multiple truck operations with newer equipment are compared to single truck operations with older equipment given the different assumed performance metrics for each company type as developed from survey averages (Tables 2.1 and 2.7). On the right are the percentage differences when multiple truck operations with newer equipment are compared to single truck operations with older equipment when miles traveled, tons hauled, and hours worked are held constant at the total survey average. Note that fixed costs are higher for the newer trucks (higher truck payments) but variable costs are lower (less repairs). For circumstances presented here with caveats offered above, savings on variable costs for multiple truck companies fail to offset higher fixed cost of operations resulting in a 12% higher average cost of operations for 2008 simulations.
It should be pointed out, in regards the comparison above, that newer truck owners and older truck owners are both needed for a sustainable least-cost industry. Both benefit from a reciprocal equipment relationship. The newer truck owner requires the older truck owner to purchase a truck retired after seven years of operation. The older truck owner must rely upon the newer truck owner for provision of used trucks and lowered investment necessary for entry to the industry. The preceding simulations presented an analysis of non-wage costs of log truck operation with emphasis on changing fuel prices, rather than a conclusive comparison of operation type cost efficiencies. Current (2008) non-wage operating costs fall within the ranges of $1.58 to $1.72 per mile, $6.03 to $7.64 per ton, and $34.19 to $38.84 per hour. The average non-wage total operational cost increase from 2006 to 2008, resulting primarily from fuel prices, has been within the range of 34% to 38%. Operating Cost Simulations with Wages Considered Washington Log Truck IndustryAn investigation of the complete costs of providing safe truck service in the logging industry needs to consider wages and wage-related costs. Surveyed companies and interviewed truckers were asked about compensation. Survey results showed that log hauling companies in Washington with employed drivers utilize two primary approaches for compensation; per hour and pay as a percentage of the truck daily gross return. Survey responses indicate truck drivers receive either an average wage of $16.09 per hour or are paid based upon 32.0% of the gross for the truck. The U.S. Department of Labor Bureau of Labor Statistics (USBLS 2008) tracks wages in the state for most occupations. Unfortunately, log trucking is not tracked as a distinct occupational classification. We speculate that USBLS does not track log truck operator wages because independent operators are not subject to employment security scrutiny and hired drivers may be listed as employed in other occupations. For example, drivers employed by trucking firms may be listed as heavy truck operators while those employed by logging companies may be classified as loggers. However, current average wages for related occupational classifications as reported by USBLS for Washington State (Table 2.19) suggest that our survey averages for wage payments (Table 2.20), are not unreasonable, and may even be conservative. Table 2.19. Average 2007 hourly wages for selected occupations as reported by USBLS.
Table 2.20. Average driver compensation alternatives indicated by survey respondents.
Responses to the log truck survey income questions suggested that some independent truckers may be less than certain about how much they actually earn per hour. Given an average driver age of 55 years, it is apparent that most log truckers spent a significant portion of their early careers delivering logs during the years when rates were set by the State. Under such circumstances, knowledge of practical accounting for individual firms may not have been essential. This has not been the case, however, since deregulation. Another characteristic, possibly more apparent in the log hauling industry as compared to other businesses, is the degree to which truckers regard their work as a lifestyle as much as a source of income. Discussions with truckers conducted during this investigation, corroborated by analysis of survey response data, suggested that operators compensate for challenging income situations by working extended hours of service and by doing their own maintenance and repairs. Several respondent companies indicated that wives do the bookkeeping and receive no compensation. Many independent truckers appear to accept their income as being whatever is left at year-end rather than as part of a rate calculation prior to acceptance of a haul commitment. Survey responses in the following tables reflect the informal nature of log hauling contracts. Table 2.21. Log truck survey question 22: “Do you know what you will be paid prior to beginning a new haul from a logging site?”
Table 2.22. Log truck survey question 23: “How long from the time of haul until you are paid?”
As Brown commented back in 1936, when independent log hauling commitments are established by small “gyppo” contractors, some of whom may underestimate the total cost of operations, uneconomic competition can be the result leading to attrition in the industry. In order to offer a representative range of the costs of operating a log truck for each company example, we developed one low-cost scenario (A) in which we use the suggested hourly wage of $16.09 but consider this as a flat rate in lieu of over-time and do not include insurance benefits. In the high-cost scenario (B), we model as for more conventional businesses and use the suggested hourly wage for the first 40 hours per week but increase to $24.14 (“time-and-a-half”) for over-time hours in excess of 40 hours per week. For the high-cost scenario, we also include costs of insurance benefits for a 55-year-old driver and spouse. Survey analysis indicates that 50% of company owners provide themselves with health care benefits while 29% report extending similar benefits to employees. Other employment benefits such as retirement plans and paid vacations were not included for analysis but, if provided, would increase benefits costs. The following section expands upon the analysis developed for non-wage costs of operations by adding low-cost and high-cost compensation scenarios for each sample company type for the years 2006 and 2008. Driver income for all simulations is anchored to a suggested average wage of $16.09 per hour. Hourly rates verses percent of truck gross are compared. Total Costs of Operation for a Company with a Single Log TruckScenario 1A – Costs of Operation for a Company with a Single Log Truck The self-employed driver does not pay State Labor and Industries taxes and does not pay Employment Security taxes. Social Security (Federal Insurance Contributions Act tax, FICA), as required by law for the self-employed, was calculated at 15.3% of earnings. All hours were considered straight time ($16.09 per hour) and no health insurance benefits were provided. All results are before federal income tax, do not include pension accommodations, and are presented as company costs estimates, not as revenue targets. All non-wage costs were held constant from previous simulations by company type. Cost results are provided for 2006 and for 2008. Scenario 1B – Costs of Operation for a Company with a Single Log Truck We modeled the same cost inputs as in Scenario 1A except compensation for hours worked was calculated with straight time ($16.09 per hour) for the first 40 hours each week and overtime ($24.14 per hour) for addition hours each week. Health insurance benefits were added for a 55 year-old company owner and spouse. Insurance rates of $841 per month (2006) and $984 per month (2008) were provided for the Regence Blue Shield Individual Plan© with $,$1,500 deductible. This company provides insurance to approximately 500 employees and members of the Washington Contract Loggers Association (Dynes 2008). All results are before federal income tax, do not include pension accommodations, and are presented as company costs estimates not as revenue targets. All non-wage costs were held constant from previous simulations by company type. Cost results are provided for 2006 and for 2008. Table 2.23 1A - 2006 Cost of Operations for a Company with a Single Log Truck. Table 2.24. 1A - 2008 Cost of Operations for a Company with a Single Log Truck. Table 2.25. 1B - 2006 Cost of Operations for a Company with a Single Log Truck. Table 2.26. 1B - 2008 Cost of Operations for a Company with a Single Log Truck. Total Cost of Operations for a Multi-Truck CompanyScenario 2A – Cost of Operations for a Multi-Truck Company Washington State businesses with employees are required to pay State Labor and Industries Insurance and Employment Security taxes. For the theoretical company, modeled here as an employer of log truck drivers, we used a State Industrial employer obligation of $3.00 per hour and an Employment Security tax of 1.7% of wages. The employer contribution to FICA is 7.65% of wages. All hours were considered straight time ($16.09 per hour) and no health insurance benefits were provided. All results are before federal income tax, do not include pension accommodations, and are presented as company costs estimates not as revenue targets. All non-wage costs were held constant from previous simulations by company type. Cost results are provided for 2006 and for 2008. Scenario 2B – Cost of Operations for a Multi-Truck Company We modeled same cost inputs as in Scenario 2A except compensation for hours worked was calculated with straight time ($16.09 per hour) for the first 40 hours each week and overtime ($24.14 per hour) for addition hours each week. Health insurance benefits were provided for a 55 year-old driver and spouse. Insurance rates of $828 per month (2006) and $969 per month (2008) were provided by the Regence Blue Shield Group Plan© with $1000 deductible as the most comparable to the Regence Blue Shield Individual Plan© as shown for the owner-operator scenario above. This company provides insurance to approximately 500 employees and members of the Washington Contract Loggers Association (Dynes 2008). All results are before federal income tax, do not include pension accommodations, and are presented as company costs estimates not as revenue targets. All non-wage costs were held constant from previous simulations by company type. Cost results are provided for 2006 and for 2008.
Table 2.27. 2A - 2006 Cost of Operations for a Multi-Truck Company. Table 2.28. 2A - 2008 Cost of Operations for a Multi-Truck Company. Table 2.29. 2B - 2006 Cost of Operations for a Multi-Truck Company. Table 2.30. 2B - 2008 Cost of Operations for a Multi-Truck Company.
Results and Discussion - Simulations of full cost of operationsFull cost of operations analysis for a 1998 six-axle long-logger by an owner-operator company with a single log truck – 2006 & 2008 compared Scenario 1A – Cost of operations for a Company with a Single Log Truck Results, presented for 2006 and 2008, indicated that the average cost of small company operations with wage-related costs excluding overtime and health insurance for a 1998 six-axle long-logger in 2006 was $2.02 per mile. By June 2008, this cost had increased to $2.46 per mile. The average cost per ton in 2006 was $7.71 while the average cost per ton in June 2008 was $9.38. The average cost per hour in 2006 was $43.72 while in June 2008 the average cost per hour was $53.16. Simulation 1A findings indicated an increase in cost of operations from 2006 to 2008 of 22%. Table 2.31 shows total cost/unit measure (for simulation 1A) presented as the sum of fixed and variable cost or as no-wage and wage cost.
Scenario 1B – Cost of operations for a Company with a Single Log Truck Results, presented for 2006 and 2008, indicated that the average cost of small company operations with wage-related costs including overtime and health insurance for a 1998 six-axle long-logger in 2006 was $2.36 per mile. By June 2008, this cost had increased to $2.83 per mile. The average cost per ton in 2006 was $9.01 while the average cost per ton in June 2008 was $10.78. The average cost per hour in 2006 was $51.07 while in June 2008 the average cost per hour was $61.08. Simulation 1B findings indicated an increase in cost of operations from 2006 to 2008 of 20%. Table 2.32 shows total cost/unit measure (for simulation 1B) presented as the sum of fixed and variable cost or as no-wage and wage cost.
Comparison of 1A and 1B Addition of overtime and health insurance benefits for the small company owner-operator increased the total cost of operations in 2008 by 14.9% with a wage base rate of $16.09 per hour. As mentioned above, some companies determine driver wage based upon a percentage of the gross (32% was the survey average). A comparison of the hourly and percentage-based average wage rate produced interesting results. While percent share for a driver is based upon gross revenue not total costs, for relative comparisons we calculated a percent share of total costs as derived from the $16.09 hourly wage anchor. When the percentage share remained constant at 32.0% from 2006 to 2008, driver earnings increased as the price of fuel increased. In 2006, the hourly rate produced the highest annual income for both 1A and 1B scenarios, whereas, in 2008, this was not the case. 2008 simulations for 1A (no overtime or benefits) produced a 5.4 percent benefit for the percent wage but when overtime was included the hourly wage and the percentage wage were very close to equal (Table 2.33). Some trucking companies have reported establishing contracting relationships in recent years that make periodic adjustment to haul rates by adding a fuel surcharge to accommodate spikes in the diesel price that could otherwise result in operation losses. If fuel surcharges become a common market arrangement to equitably absorb periodic increases in fuel costs, the use of a simple percentage of the gross as means to determine wages would produce undesirable results more linked to fuel price than productivity and without some adjustment might serve to undermine the effectiveness of fuel surcharges at offsetting the impacts of rising diesel prices. Further examination of wage calculation implications occur in Table 2.36. Fuel is the single largest cost of log truck operations and wages is the second largest cost.
Full cost of operations analysis for a new six-axle long-logger by a multi-truck company – 2006 & 2008 compared Scenario 2A – Cost of operations for a Multi-Truck Company Results, presented for 2006 and 2008, indicated that the average cost of fleet operations, with wage-related costs excluding overtime and health insurance, for a new six-axle long logger in 2006 was $2.22 per mile. By June 2008 this cost had increased to $2.65 per mile. The average cost per ton in 2006 was $9.84. The average cost per ton in June 2008 is $11.78. The average cost per hour in 2006 was $50.04 while in June 2008 the average cost per hour is $59.89. Simulation 2A findings indicated an increase in cost of operations from 2006 to 2008 of 20%. Table 2.34 shows total cost/unit measure (for simulation 2A) presented as the sum of fixed and variable cost or as no-wage and wage cost.
Scenario 2B – Cost of operations for a Multi-Truck Company Results, presented for 2006 and 2008, indicated that the average cost of fleet operations, with wage-related costs including overtime and health insurance, for a new six-axle long logger in 2006 was $2.52 per mile. By June 2008 this cost had increased to $2.98 per mile. The average cost per ton in 2006 was $11.20 and was $13.24 in June 2008. The average cost per hour in 2006 was $56.93, while in June 2008 the average cost per hour was $67.33. Simulation 2B findings indicated an increase in cost of operations from 2006 to 2008 of 15%. Table 2.35 shows total cost/unit measure (for simulation 2B) presented as the sum of fixed and variable cost or as no-wage and wage cost.
Comparison of 2A and 2B Addition of overtime and health insurance benefits for employee drivers working for a multiple truck company increased the total cost of operations in 2008 by 12.4% with a wage base rate of $16.09 per hour. Simulated comparisons of hourly verses percent wage calculation were developed for cost analysis scenarios 2A and 2B. Table 2.36, below, contains results as were presented for scenarios 1A and 1B in Table 2.33. When the percentage share remains constant at 32.0% from 2006 to 2008, driver earnings increase with the price of fuel. In 2006 for scenario 2A, which excluded overtime, the percentage rate produced about 3% more annual income than the annual income from the hourly wage. When allowance for overtime was included (scenario 2B), the situation reversed; the hourly wage scenario for 2006 produced about 3% higher annual income than the percentage. For 2008, the percentage share of truck costs produced significantly higher annual income from both the A and B simulations. Worthy of note is that the 2008 percentage income for 2A (straight time) is greater than the 2008 income from the hourly wage with overtime included (2B). This was not the case for the owner-operator simulations (Table 2.33). Our demonstration of hourly wage verses percentage calculations to determine truck driver income (Tables 2.33 and 2.36) has been offered here to demonstrate the potential impracticality of percentage-based wage calculation when cost of operations fluctuates independent of productivity.
Implications of Business and Occupation TaxesOur review of cost implications for the hourly wage verses the percentage wage highlights an important reality for trucking companies. Increases to variable costs such as fuel or compensation result in correspondent increases to total cost of operations and, consequently, to any element of operations costs that is determined as a percentage of the total. The Washington Business and Occupation Tax (B&O Tax) is calculated at 1.926 percent of gross revenues. An examination of the implications of B&O Taxes relative to increases in fuel costs and worker compensation was conducted using our simulations of log truck operation costs examples.
From the B&O Tax Table 2.37, presented above for the single-truck examples (Scenarios 1A and 1B; 2006-2008), we can see that, depending upon scenario, B&O Taxes associated with fuel and wages accounted for between 70% and 79% of the total B&O Tax responsibility. In 2008, simulated B&O Taxes for fuel cost alone were $1,226 per year. Based upon miles traveled per year (66,122) and rate of fuel consumption in miles per gallon (5.1), we estimated that, for this cost simulation, 12,965 gallons of fuel were used annually. With 2008 fuel price, B&O Taxes function as an additional $0.10 per gallon fuel tax except, unlike actual fuel taxes, B&O Taxes are calculated based upon the total price at the pump, which includes significant state and federal taxes. From 2006 to 2008, although loads of logs hauled remained constant, the increase in the price of fuel resulted in an increase in the total B&O Tax of 18.4% to 21.4% for the single-truck company example. Wage-related costs were also double-taxed; in addition to direct wages and benefits, B&O Taxes are charged against FICA expenditures.
Tax exposures are more onerous for employers. From the B&O Tax Table 2.38, presented above for employer examples (Scenarios 2A and 2B; 2006-2008), we can see that, depending upon scenario, B&O Taxes associated with fuel and wages account for between 67% and 75% of the total B&O Tax responsibility. While the percentage increase to total costs goes down slightly for the employer, the actual cost goes up. The implications of B&O Taxes on fuel costs remain the same for both truck simulations; about $0.10 per gallon of fuel at 2008 price. Recall that the fleet company fuel costs are higher because the simulation showed the fleet truck traveling more miles per year. From 2006 to 2008 although loads of logs hauled remained constant, the increase in the price of fuel resulted in an increase in the total B&O Tax of 17.2% to 19.6% for the multi-truck company example. In addition to direct wages and benefits, for employers, B&O Taxes are charged against FICA, Labor and Industries, and Unemployment Security expenditures. B&O Taxes add to cost burdens for companies such as log haulers with fixed levels of productivity that struggle to accommodate increasing variable costs of operations such as fuel and wage-related costs. B&O Taxes, as currently levied, can affect employees by lowering company profitability and serving as a disincentive for employers to provide better wages and benefits. Analysis Summary and Conclusion - Total Costs of Operating a Log TruckLog hauling business scenarios were previously synthesized to provide benchmark ranges of fixed, variable, and total costs. Special attention to significant increases in variable costs for the log truck industry from 2006 to 2008 was presented. The tables below display summary cost ranges from the simulation results.
Cost of operations compared to average survey-reported gross revenues The average annual gross revenue for 2006 for a log trucking company as reported by 103 survey respondent companies was $137,775 (Table 2.41). A comparison of this gross return to simulated cost of operations for 2006 suggests that average revenues for log truck companies were marginally equivalent to our lowest estimate of full cost of operations as modeled for the 2006 owner-operator scenario (1A; without overtime or benefits). Annual estimated costs of operations are shown below in Table 2.42 for 2006 and 2008 based upon low (1A) and high (2B) operations simulations. Table 2.41. Log truck survey results for 2006 gross return.
The authors have simulated above a representative range of the average cost of operations for a log truck in Washington. Input data were developed from a broad survey of log trucking firms and discussions with vendors and institutional associations, allowing a thorough investigation of the industry. Our investigation results are, therefore, to be considered as reasonable averages that approximate cost magnitudes and sensitivities. Costs will logically vary considerably for individual businesses. Additional costs may be present that have not been included in this review. Federal income taxes are calculated from revenues and consequently were not included in our cost analysis. Results are to be considered as conservative estimates of baseline required operating expenses based upon best available information. Table 2.43, presented on the final page of this report section, provides a side-by-side comparison of the 2008 least-cost annual operational costs estimates (self-employed driver: older truck with no overtime or benefits) as compared to high-cost annual operational costs estimates (employed driver: new truck with full overtime and benefits). It should be noted that the least-cost example should be considered as applicable only for owner-operators as wage-related costs for an employer, with all other costs held constant, would increase total annual costs of operation for the least-cost example by approximately $6500 per year. Current regulations do not allow denying employees overtime. To hold total annual costs constant at the level of the least-cost example and apply to a company with hired drivers, the hourly wage would be significantly reduced to approximately a net of $11.75 per hour in order to accommodate the calculation requirement of time-and-a-half for weekly hours worked over 40.
Table 2.43. 2008 estimated total cost of operations (fuel = $4.91/gallon; wages = $16.09/hour). Ranges reflect low on left (1A owner-operator: 1998 truck with no overtime or benefits) to high on right (2B employed driver: new truck with full overtime and benefits). |


