|
January 2005
By Elaine Oneil
Save or Print
a PDF copy of Fact Sheet
#31
Stand density index (SDI) has been used to rank eastern
Washington forest conditions relative to stocking targets
for forest health (see RTI
FS 25). However, the SDI approach
assumes that we have an accurate assessment of stand viability
at a given density and quadratic mean diameter (DBHq).
To better determine what SDI level is indicative of stands
that are likely to be healthy, we use a measure of stand
vigor called growth basal area (GBA). Stand vigor has historically
been linked to GBA in eastern Washington dry sites as it
reflects inherent site carrying capacity better than measures
of density, relative density, and basal area. An examination
of estimated GBA across eastern Washington habitat types
shows wide variability depending upon species and site
characteristics. Categorizing this variability into a usable
system will be of value to policy makers and small landowners
in the development of stocking level targets that meet
forest health goals in a sustainable manner.
|
|
Of current concern in eastern Washington forests
is the proliferation of stand replacing disturbances of a magnitude
thought to be beyond the historic range of variability (Everett
et al. 2000). These stand replacing events, whether from fire,
insect epidemic, or disease have garnered the attention of
policy makers and the public, especially the people who live
in affected communities. The premise in the forest health discussion
is that the forests are ‘stressed’ and thus subject
to increasing pressure from natural vectors because of ‘overstocking’.
In looking for solutions to forest health problems, we need
to combine knowledge of plant physiology, stand dynamics, and
site specific ecological metrics to determine when a forest
is ‘overstocked’ and vulnerable to health decline.
Only then can we determine optimal treatments, designed for
density reductions to maintain healthy forest conditions.
The historic management approach over the last 100 years has
favored continuous forest cover and ‘uneven-aged’ management
strategies combined with fire suppression. The result has been
multi-layered stands of shade-tolerant species across much
of the landscape. Insects and disease build up in multi-layered
stand structures resulting in extensive epidemics because of
the continuity of food sources for these forest health vectors.
In addition, the focus of many foresters on a ‘normal
forest’ or full stocking management emphasis may have
led to broad misunderstanding of ‘overstocked’ conditions
relative to stand carrying capacity. Metrics such as Curtis’ Relative
Density (RD) and Reineke’s Stand Density Index (SDI)
were developed to provide standardized stocking metrics relative
to a ‘fully stocked’ stand, but only with Hall’s
(1989) growth basal area (GBA) do we get an actual measure
of stand vigor relative to site. Growth basal area is defined
as the basal area measured in square feet/acre that a stand
can carry and still maintain growth rates of 1”in diameter
at breast height/decade for dominant trees at 100 years of
age. By keying stocking levels to growth rate, a site specific
determination of when the stand is ‘carrying a high basal
area’ is possible. Using GBA, the range of potential
forest health impacts that an individual forest owner might
encounter for different stocking levels can be estimated. For
example, GBA is indexed to a growth rate where susceptibility
to attack by mountain pine beetle (MPB) (Dendroctonus ponderosae,
Hopkins.) is reduced (Hall 1989, Sartwell 1971).
The mechanics of tree physiology support the use of GBA
as a response variable for measuring site carrying capacity
and as a useful proxy for relative tree stress as a function
of stocking densities, diameter distributions, and species.
Trees allocate resources to diameter growth and defense against
insects and disease after a host of other priorities including
root and shoot growth, scar tissue development, cone development,
and height growth. By virtue of location in the ranking of
resource allocation, diameter growth provides a useable estimator
for tree vigor and stand health, both of which are closely
linked to the potential for insect and disease impacts when these vectors are present. At epidemic levels, the relationship
between the tree host and insect and disease vectors requires
a substantially different approach to management beyond application
of density control measures.


|
Carrying capacity as measured by stand basal
area growth is best estimated after the initial spring flush
of root, shoot, cone, and height growth is complete. Diameter
growth is more responsive to growing-season water stress
than height growth which occurs in the early part of the
growing season for most eastern Washington coniferous species.
Since stand stress is related to limitations on the availability
of growing-season moisture and nutrients, we can use diameter
growth of dominant trees and the stocking density of the
forest stand as measured by basal area (BA) and quadratic
mean diameter (DBHq) to estimate stand stress and the subsequent
reduced resilience to forest pests. To test the correlation
between basal area growth and stand stress causing reduced
resistance to forest health vectors, we simulated growth
across a variety of habitat types and mapped these outputs
against the threshold basal areas reported in field studies
on stands having similar site indices and/or habitat types.
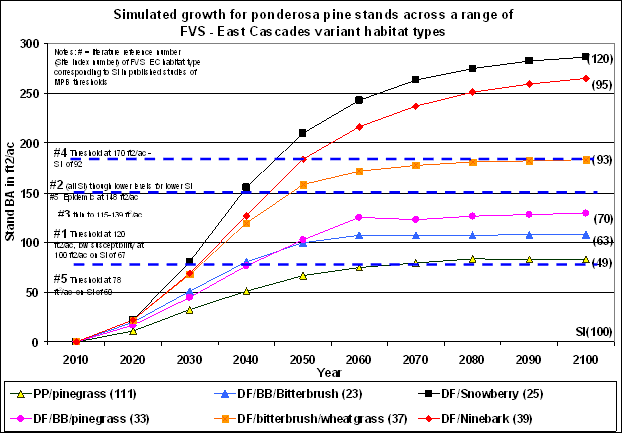
Simulations of ponderosa pine (Pinus ponderosa) regenerated
at an initial density of 400 trees/acre using default site
index and stand density index by habitat type for the East
Cascades (EC) variant of the Forest Vegetation Simulator
(FVS) were used to generate the range of curves shown in
Figure 1. As expected, growth limiting factors vary by habitat
type resulting in different basal area maxima over the 100
year simulation period.

| Figure 1: |
Ponderosa pine growth on various habitat
types in the East Cascades as simulated by FVS
Threshold values are from: #1 Schmid and Mata 1992, #2
Sartwell and Stevens 1975, #3 Sartwell 1971, #4 Oliver,
W.W. 1995, #5 Larsson et al. 1983. |
Basal area ‘thresholds’ (the dotted lines) for
Mountain pine beetle (MPB) reported in the literature plotted
against these growth curves demonstrate a trend toward increasing
the estimated stocking ‘threshold’ for bark beetle
outbreak as site quality increases. While the basal area
threshold of 150 ft2/acre reported by Sartwell and Stevens
(1975) has
been accepted as an average threshold for MPB in ponderosa
pine, there have been a wide range of reported thresholds
for differing site conditions. At the lower end, Larsson
et al.
(1983) report a basal area threshold for MPB outbreak of
78 ft2/acre on stands with an estimated site index of 60
feet
in 100 years, while Oliver (1992) reports a threshold of
170 ft2/acre of basal area on stands with a site index of
92 feet
in 100 years. The broad range of thresholds reported suggests
that site quality plays an important role in determining
maximum stocking levels that can be sustained such that the
forest
stand retains adequate resistance to endemic levels of insects
and disease.


|
A suitable measure of site quality for estimating
the potential for forest health problems across the landscape
should be sensitive to diameter growth. The most commonly
used measure of site quality is site index which is relatively
insensitive to stand density and is a poor indicator of diameter
growth potential. However, site index is useful to separate
diameter growth potentials into smaller ‘bins’ for
eventual classification and application of ‘rules of
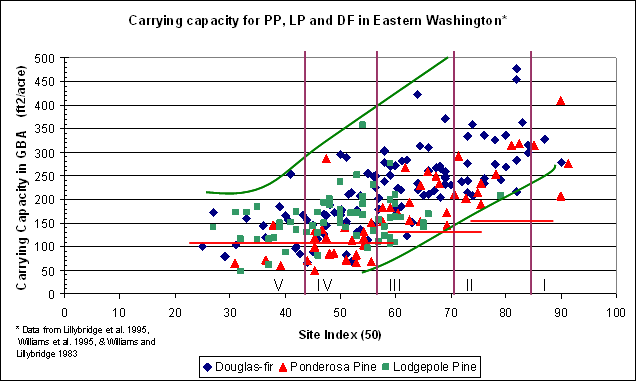
thumb’. As an example, Figure 2 shows the relationship
between GBA and site index for Douglas-fir (Pseudotsuga
menziesii),
ponderosa pine, and lodgepole pine (Pinus contorta) on mapped
upland habitat types in eastern Washington. An overlay of
site class (site index groupings) on the GBA/SI relationship
in Figure 2 demonstrates that there is a broad range of GBA
that occurs within a given site class and for a given species.
The variability in GBA would imply that an approach to forest
health using average metrics may not address the thresholds
of risk associated with multiple species and different habitat
types. A system that specifies assessment criteria based
on habitat type groups may be appropriate in meeting forest
health goals in the context of other management criteria,
but it will take time to develop this approach and provide
the necessary training and education for its implementation
in the field. Conversely, grouping the GBA values by site
index ‘bins’ provides a simple means of reducing
forest variability into management subsets for most species.
An exception is lodgepole pine which has GBA values that
are not well correlated to site index.

| Figure
2: |
Stand
carrying capacity by species and site index for eastern
Washington habitat types. |
Use of site index or site class for forest growth classification
is commonly accepted in current forest practices rules
and within the larger field forestry community. By using
site class ‘bins’ to estimate the biological
thresholds for insects and disease, a series of look-up
tables can be generated that would
identify risk thresholds by diameter, stocking level and/or
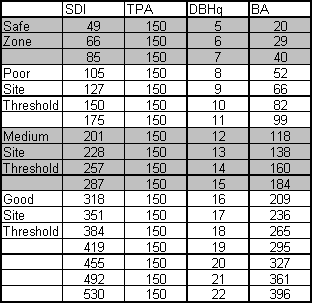
basal area target. An example table is given in Table
1.


|
Table 1 uses target densities
of 150 TPA to illustrate carrying capacity thresholds leading
to forest health risks as derived from the relationship between
minimum GBA and site class (Good, Medium, Poor) as given
in Figure 2. Tables can be created for any diameter and density
target to assess forest health risks relative to stand carrying
capacity and site quality. The look-up table simplifies the
threshold decision criteria for a given density or diameter
target, but does not substitute for the need to collect stand
data to confirm site GBA and adapt management targets to
integrate forest health with volume, habitat, or structural
goals. It is worthy of note that the data used to derive
these look-up tables have been developed from national forest
ecological classification inventory plots. Carrying capacity
may be reduced if expectations of changing future climatic
conditions are realized (McKenzie et al. 2004).
|
Table 1: Stand metrics for a target density
of 150 TPA including assessment of forest health risk by
site class.

|
Conclusions
Forest health challenges can be addressed by considering site parameters and
the multiple metrics that influence stand dynamics. Defining appropriate
stocking levels across a range of density, diameter and basal area targets
is one step toward developing desired future forest health conditions. Immediate
classification steps are possible using existing data on site index and GBA
by habitat type, but an assessment procedure that specifically incorporates
habitat type and measured growth basal area into site quality equations for
forest health is needed to determine appropriate stocking levels across the
landscape. Categorization of forest variability into a usable system for
policy makers and landowners will help to ensure density management strategies
can meet desired future conditions and forest health goals simultaneously.

References:
- Everett, R., R. Scellhaas, D. Ketchum, D. Spurbeck
and P. Ohlson, 2000, Fire history in the ponderosa pine/Douglas-fir
forests on the east slope of the Washington Cascades,
Forest Ecology and Management 129: 207-225.
- Hall, Frederick C., 1989, The concept and application
of Growth Basal Area: A forestland stockability index,
R6-Ecol Tech Paper 007-88, USDA FS, PNW Region
- Larsson, S., R. Oren, R.H. Waring and J.W. Barrett,
1983, Attacks of mountain pine beetle as related to tree
vigor of ponderosa pine, Forest Science, 29(2):395-402.
- Lillybridge, Terry R., Bernard L. Kovalchik, Clinton
K. Williams, and Bradley G. Smith, 1995, Field Guide
for forested plant associations of the Wenatchee National
Forest, PNW-GTR-359, USDA FS Pacific Northwest Research
Station.
- McKenzie, D., Z. Gedalof, D. Peterson and P. Mote,
2004, Climate change, wildfire, and conservation, Conservation
Biology, 8(4):890-902.
- Oliver, W.W., 1995, Is self thinning in ponderosa pine
ruled by Dendroctonus bark beetles? In Proceedings of
the 1995 National Silviculture Workshop titled Forest
Health through Silviculture, Rocky Mountain Gen Tech
Rpt #267, USDA FS RM For and Rg Exp Stn.
- Sartwell, C., 1971, Thinning ponderosa pine to prevent
outbreaks of mountain pine beetle. In David M. Baumgartner
(ed.) Pre-commercial thinning of coastal and intermountain
forests in the Pacific Northwest, p 41-52, Washington
State University Cooperative Extension Service, Pullman,
WA.
- Sartwell C. and Stevens, R.E. 1975, Mountain Pine Beetle
in Ponderosa Pine – prospects for silvicultural
control in second growth stands, Journal of Forestry,
73:136-140.
- Schmid, J.M. and S.A. Mata, 1992, Stand density and
mountain pine beetle caused tree mortality in ponderosa
pine stands, Research Note RM 515, USDA FS RM For and
Rg Exp Stn
- Williams, Clinton K., and Terry R. Lillybridge, 1983,
Forested Plant Associations of the Okanogan National
Forest, USDA Forest Service, Pacific Northwest Research
Station, R6-Ecol-132b-1983.
- Williams, Clinton K., Brian F. Kelley, Bradley G. Smith,
and Terry R. Lillybridge, 1995, Forested Plant Associations
of the Colville National Forest, USDA Forest Service,
Pacific Northwest Research Station, Gen Tech Rpt., PNW-GTR-360.

|
|


