 |
 |
 |
 |


Working Paper 2
An Examination of the Washington Department of Natural Resources Timber Sale Program Against a Backdrop of Changing Regional Infrastructure and a Growing Forest Health CrisisC. Larry Mason
This report represents a synthesis of information provided from many sources. The work of the research team included review of the literature, interviews with individuals, companies, and other organizations, the development and implementation of the project survey, and the synthesis, analysis, and report of all collected information. The project leader and report author is Larry Mason, Project Coordinator for The Rural Technology Initiative (RTI). Members of the research team included Bruce Lippke, Economics Professor at the University of Washington College of Forest Resources and Director of the RTI; Nick Kirkmire, senior forestry consultant, and Kevin Ceder, Forestry Technology Specialist for the RTI. Additional support was provided by RTI staff, Luke Rogers, Kevin Zobrist, Ara Erickson, and James McCarter, as well as from RTI graduate students, Elaine Oneil and Derek Churchill. Administrative support was provided by Nicole Stevens and Clara Burnett. Important for the success of this project was the cooperation received from the many professionals that were contacted within the Washington Department of Natural Resources (DNR). No request for information went unanswered. DNR contributors included: Jon Tweedale, George Shelton, John Haddon, Mike Chandler, Pat Ryan, David Larsen, Pete Holmberg, Karen Ripley, Judie Cline, Karen Jennings, Mark Savage, Bruce Glass, Tom Heller, Bob Bannon, Dave Gordon, Jacki Verdi, Angus Brodie, Mark Gray, Len Riggins, and many others. Other major information contributors included: Roy Nott (Paneltech), John Perez-Garcia (Center for International Trade in Forest Products at the University of Washington), Malcolm ‘Bob’ Dick (American Forest Resource Council), Bill Pickel (WA Contract Loggers Association), Phil Rigdon and Everett Isaac (Yakama Nation), Tim Gammell (Forest Resources Association), Craig Adair (American Plywood Association), Henry Spelter (USDA Forest Products Laboratory), Martin Faulkner (Norbord Inc.), and many others. Critically important to the completion of this project were the countless conversations with log buyers, mill managers, timber merchandisers, consultants, scientists, and other forestry professionals that provided inside information and professional insights in regards current harvesting, manufacturing, and marketing developments within the region and beyond. Special thanks go to the many DNR timber purchaser representatives that took time from their busy schedules to respond to the project survey. Without access to current information on purchaser needs and preferences, refinements to the DNR timber sales program designed to provide the best log to best buyer for the best return with the best environmental results would be impossible. This work was made possible by a Community Assistance and Economic Action Program Grant WNZ-ME-983 within the Multi-Agency National Fire Plan administered by USDA-Forest Service. Any opinions, findings, conclusions, or recommendations expressed
in this publication are those of the author and do not necessarily
reflect the views of the funding agencies or project cooperators. Forest health harvesting activities to remove excess fuel loads from overstocked stands conducted within DNR forests in eastern Washington are expected to produce merchantable timber volumes of 25-35 million board feet Scribner (MMBF) per year for the next 5-7 years. As yet undetermined volumes of trees too small for most DNR timber purchasers will also be removed to reduce current fuel loads. Other recent adjustments to the DNR timber sale program such as the recent recalculation of the annual sustainable harvest and amendments to the State Habitat Conservation Plan are expected to result in additional increases of 100 to 150 MMbf in annual timber sales volumes as compared to recent years. Important to the success of forest health harvest activities will be the development of effective strategies for the sale of logs removed. Keywords: Washington Department of Natural Resources forest
health, State timber sales, forest products, logs, lumber,
engineered wood products, biomass-to-energy, economic development,
sustainability. For this investigation a review of available
literature including scientific reports, journals, conference
proceedings, and
other topical publications as well as DNR and other governmental
agency reports and applicable Washington State and United
States policies and laws has been considered against a
broader backdrop of state, regional, and global influences.
Numerous
interviews were conducted by phone, email, and personal
conversation with DNR personnel, Forest Service personnel,
industry professionals,
tribal foresters, timber purchasers, and university scientists.
In order to better understand the capabilities and preferences
of current and potential DNR timber sale purchasers in
WA, OR, CA, and ID, a survey was designed and distributed for
response. However, the expectation from purchasers is that the greatest potential use of small diameter timber from DNR forests will be for chips. This situation should be cause for concern given the continuing decline of the pulp and paper industry in the region and that there is no industry expectation for future investment. Another potential use for small diameter logs and forest biomass is biomass-to-energy generation. While there appears to be growing public interest in biomass-to-energy projects, a majority of surveyed timber purchasers indicated that small diameter trees would most likely be used for chip production not energy generation. A feasibility study commissioned by the Yakima County Public Works Department concluded that forest biomass was too expensive to harvest and not reliably available to warrant investment in a biomass-to-energy conversion facility. However, evolving state and federal policies may provide public investment dollars for biomass-to-energy projects which, combined with the rising cost of fossil fuel energy, could offset high harvest and haul costs to change the currently unfavorable economics of energy generation from biomass as compared to natural gas or coal. Oriented Strand Board (OSB), laminated veneer lumber (LVL), and other engineered wood products (EWP) continue to gain market share over traditional wood products such as plywood and lumber products. EWP manufacturing processes can utilize small diameter logs. Large EWP markets exist on the west coast yet there is little domestic manufacturing capacity west of the Mississippi River. The currently unfavorable economics of biomass-to-energy projects, the continuing decline of the Pacific Northwest pulp and paper industry, the high cost of harvest and production, the relative lack of regional EWP manufacturing capacity, and the transportation challenges that isolate many forest areas of Washington are all factors that undermine the potential for profitable utilization of small logs in the near term. In the absence of sufficient federal harvest assurances, infrastructure investment incentives, and price supports for alternate energy projects, private sector investment in specialized industrial capacity to absorb small diameter low value logs has not been forthcoming. However, survey results indicate that purchasers have interest in new investment if reliable and adequate log supplies will be made available. In eastern Washington, new forest health contracting flexibilities combined with new management targets created by amendments to the DNR Habitat Conservation Plan (HCP) should mean that greater and consistent volumes of small diameter logs from state lands will be available. DNR will be well advised to look for ways to cooperate with federal, state, tribal, and local economic development interests that seek to create new incentives for small log utilization programs for energy, paper products, or engineered wood products. As a result of policy changes, annual timber harvest volumes from federal forest lands have declined in Washington to only 5% of 1988 levels but a forest health emergency on these lands has resulted in new political pressure to increase harvest. A substantive increase in available federal timber could improve forest health and provide opportunities for economic development; however, abrupt increases to timber supply would have negative impacts for log markets in the region. When survey respondents were asked if they thought that volumes of timber would likely increase from federal lands, 63% indicated increases are unlikely or impossible and 21% responded that they were uncertain. Interviews with forestry professionals suggest that similar opinions are widely held in the region. Review of the literature also confirms that any increases in federal timber harvest are unlikely to be of sufficient magnitude to influence regional market dynamics. The forest products industry has undergone dramatic adjustments
during the last decade that continue today. Generally there
are much fewer players and the spectrum of product operations
has narrowed. However, a large and viable forest products industrial
sector remains. This investigation finds that aggressive timber
sale marketing adapted to changing purchaser needs and preferences
can successfully ensure maximum returns to trust beneficiaries
and will bring greater opportunities for utilization of all
log species, sizes, and qualities. As the largest public timber
supplier in Washington, the DNR is well-positioned to provide
reliable and attractive timber sale opportunities for purchasers
throughout the region which will result in significant state
revenues, environmentally responsible opportunities for economically
viable forest management, encouragement for investment in needed
regional infrastructure, and many other important values as
mentioned in this report. Table of Contents
List of Figures
List of Tables
INTRODUCTIONIn 2004, the Washington State Legislature, recognizing
deterioration of forest health as a serious environmental,
economic, and
social problem, directed the Washington Department of Natural
Resources (DNR) to initiate a program of timber sales and
other silviculture treatments for the purpose of removing
hazardous fuel loads from overstocked and distressed forests
on state forestlands to reduce risk of forest health decline
and catastrophic wildfire. New contracting flexibilities
were granted to facilitate the accomplishment of this goal
(Washington State Legislature 2004). Increasingly complex interactions of evolving science, policy, markets, economics, and public opinion within the region have combined to create unprecedented constraints and opportunities for forest management. Early in this investigation it became apparent that, perhaps as never before, forest management activities on DNR lands in eastern Washington have become inextricably linked to forestry activities within the rest of the state and beyond. This report has subsequently been prepared to provide a synthesis of pertinent informational resources to assist the DNR in the development, communication, and implementation of adaptive approaches for restoring forest health, maximizing returns to trust beneficiaries, and providing opportunities for economic development in eastern Washington as an integral part of a broader State forestland management program. 1. Background1.1 The Risk – East Side1.1.1. A Changed Forest 1.1.2. Values at Risk 1.1.3. Pre-European Conditions 1.1.4. Moisture Deficits 1.1.5. Insect Outbreaks 1.1.6. Rising Costs 1.1.7. The Legislature Acts 1.2 The Risk – West Side1.2.1. Shifting Paradigms 1.2.2. Regeneration Differences 1.2.3. Thin for Structure 1.2.4. The DNR HCP 1.3 The State Forest1.3.1. Washington
1.3.2. Five Million Acres
|
|||||||||||||||||||||||||||||||||||||||||||||||||||||||||||||||||||||||||||||||||||||||||||||||||||||||||||||||||||||||||||||||||||||||||||||||||||||||||||||||||||||||||||||||||||||||||||||||||||||||||||||||||||||||||||||||||||||||||||||||||||||||||||||||||||||||||||||||||||||||||||||||||||||||||||||||||||||||||||||||||||||||||||||||||||||||||||||||||||||||||||||||||||||||||||||||||||||||||||||||||||||||||||||||||||||||||||||||||||||||||||||||||||||||||||||||||||||||||||||||||||||||||||||||||||||||||||||||||||||||||||||||||||||||||||||||||||||||||||||||||||||||||||||||||||||||||||||||||||||||||||||||||||||||||||||||||||||||||||||||||||||||||||||||||||||||||||||||||||||||||||||||||||||||||||||||||||||||||||||||||||||||||||||||||||||||||||||||||||||||||||||||||||||||||||||||||||||||||||||||||||||||||||||||
| Purchaser Type | Washington |
Oregon |
Idaho |
California |
Total |
| Processors | 47 | 36 | 6 | 7 | 96 |
| Non-Processors | 46 | 6 | 3 | 0 | 55 |
| Total | 93 | 42 | 9 | 7 | 151 |
Table 2.2. Distribution of DNR processor respondents 2000-2002 by state.
Washington |
Oregon |
Idaho |
California |
Total |
|
| Individual Companies | 44 | 27 | 7 | 5 | 83 |
| Total Responses | 70 | 62 | 8 | 5 | 145 |
3. Results From Review Of Available Literature And Public Documents
3.1 State Forestlands
3.1.1. DNR Responsibilities
A review of federal and state laws and DNR documents reveals that the DNR has
unique management responsibilities that must be integrated as it plans for
a forest health program. The overwhelming majority of the lands administered
by the DNR are held in trusts created by federal and state laws that provide
revenues to specific trust beneficiaries. Although the management of trust
lands provides broad benefits to all the people of Washington, DNR has a
clear legal duty of undivided loyalty to each separate beneficiary to maximize
revenue generation from forested trust lands. Trust beneficiaries include
public schools, state universities, state prisons, community colleges, Capitol
buildings, and 17 Washington counties. In order to meet obligations to all
generations of beneficiaries, the DNR must manage state forest lands to balance
current and future income production such that perpetual productivity of
trust assets is insured. In addition to trust obligations, DNR must comply
with a number of federal and state statutes that protect public resources
and provide public benefits. To fulfill these mandates, there are governing
policies, procedures, and strategies for management of forested trust lands.
3.1.2. The Board of
Natural Resources
The Board of Natural Resources provides oversight. The Board of Natural Resources
is composed of six members: the Commissioner of Public Lands, the Governor,
the Superintendent of Public Instruction, the Dean of the College of Agriculture
at Washington State University, the Dean of the College of Forest Resources
at the University of Washington, and an elected representative from a county
that is a trust beneficiary. The Board of Natural Resources must approve all
major policies and management activities for DNR-managed state forest lands.
3.1.3. The Commissioner
of Public Lands
It is understood by the people of Washington that the DNR is to be a leader
in sustainable forest management and that the pursuit of this goal is publicly
recognized and respected. Achievement in this regard is insured by referendum
with a popular election every four years to select the Public Lands Commissioner
as the titular head of the DNR.
3.1.4. The HCP
Forestry in the Pacific Northwest has evolved in recent decades resulting in
shifting mandates with increasing emphasis on adaptive management to insure
long term sustainability of a broad suite of public resources (Sutherland
and Bare 2002, Washington State Legislature 2001, WAC 222-12-045). DNR interest
in adaptive forest management for the sustainable integration of forest restoration
activities with revenue generation began in the 1980’s (Commission
on Old Growth Alternatives for Washington’s Forest Trust Lands 1989).
To demonstrate its commitment to sustainability, in 1997 the DNR formally
entered into a Habitat Conservation Plan (HCP) with federal agencies under
Section 10 of the Endangered Species Act (ESA). The HCP was designed to provide
protection for threatened and endangered species such as the northern spotted
owl, as required by the ESA, while allowing more flexibility and stability
in land management activities. The HCP guides DNR management of all state
forest lands west of the Cascade Mountains but also includes some lands in
the eastern foothills of the Cascades within the SE region where northern
spotted owls are found. DNR forest lands in northeastern Washington are outside
the HCP management area.
3.1.5. 25% of Gross
Receipts
The DNR mission statement declares that the agency will provide professional,
forward-looking stewardship of the state lands, natural resources, and environment
to create a sustainable future for the Trusts and all-citizens. For the provision
of resource management services to trust beneficiaries, the DNR is authorized
to retain up to 25% of gross timber receipts to cover operating costs. The
adequacy of the 25% of gross timber receipts to cover DNR forest management
expenses is currently under review (Independent Review Committee 2004). Additional
DNR activities not connected with the generation of trust revenues are funded
independently by the State Legislature.
3.1.6. Stewardship
Forward-looking stewardship requires ongoing reassessments of available information
to support integration of design, management, and monitoring in order to
adapt and learn (Salafsky et al. 2001). There is a growing consensus amongst
silviculturalists and forest ecologists that, especially in the case of forests
that have been previously managed, opportunities exist to develop revenue
generating harvest activities that lead to ecological improvements. Fundamental
to this approach is an understanding of the dynamic nature of forests as
a shifting mosaic of age classes and vegetative structures that can be managed
at the landscape scale to insure achievement of multiple biodiversity targets
distributed through time and space (Carey et al. 1996, Oliver 1999, Lindenmayer
and Franklin 2003). Research findings indicate that comprehensive restoration
prescriptions that selectively target for removal a combination of small
and large diameter trees may be economically and environmentally desirable
in overstocked fire-prone ecosystems where failure to reduce fuel loads can
have disastrous consequences (Brown et al. 1996, Fiedler et al. 1999, Fiedler
et al. 2001). In the spirit of adaptive management, a number of factors have
converged that make this investigation timely:
- The forest health crisis
- Changes in DNR management strategies
- Changes in federal and state harvest volumes over the last two decades
- Adjustments to timber industry infrastructure
- Changes in markets for forest products
- Emerging federal forest health policies
- Strong public interest in forest management
3.2 Forest Health
3.2.1. Remove Excess
Fuels
There is a large body of evidence within the scientific literature to indicate
that many researchers are in agreement: millions of acres within inland west
forests are experiencing an unprecedented decline in forest health that has
led to fuel accumulations, catastrophic wildfires, increased risk to life and
property, destruction of ecosystems and critical habitats, and loss of valuable
timber resources. Many researchers and forest managers concur: removal of excessive
hazardous fuel loads is warranted across all forest ownerships (Courtney 2004,
DNR 2004). Policy makers at federal and state levels are also in agreement
(Babbitt and Glickman 2000, Western Governors Association 2001 and 2002, The
White House 2003, National Fire Plan 2004, Washington State Legislature 2004).
In 2000, the USDA Forest Service outlined a strategy to address forest health and wildfire in the forests of the inland west entitled Protecting People and Sustaining Resources in Fire-Adapted Ecosystems; a Cohesive Strategy (Laverty and Williams 2000). This report emphasizes that the stakes are high, “Without increased restoration treatments in these ecosystems, wildland fire suppression costs, natural resource losses, private property losses, and environmental damage are certain to escalate as fuels continue to accumulate and more acres become high-risk.”
Washington has over 1.9 million acres of forestland that contain elevated levels of tree mortality, tree defoliation, or foliage diseases. Fire suppression costs have risen due to extreme fire behavior caused by high fuel loads and increased tactical complexities (DNR 2004). Opportunities have been identified to improve habitat qualities for sensitive species, restore forest health, and generate positive economic returns through an expansion of the DNR timber sales program (DNR 2004).
3.3 New Management Challenges for the DNR
3.3.1. The Sustainable
Harvest Calculation
State law requires the DNR to manage the timber sale program for sustained
yield. Periodical adjustments to forest acreages designated for inclusion or
exclusion in the sustained yield management program along with new information
on growth and yield performance warrant a recalculation of the state sustainable
harvest forecast. This exercise was recently conducted for the western Washington
forestlands and multiple alternatives were subsequently presented to the Board
of Natural Resources for review. After examination of a spectrum of potential
harvest strategies, the Board of Natural Resources, in 2004, selected a management
alternative based upon innovative silvicultural approaches to increase production
of both complex forest habitats and trust incomes. The projected harvest volume
under the newly adopted management alternative for western Washington state
forest lands is 597 million board feet per year (DNR 2004). The average harvest
from western Washington DNR forest lands from 1998 to 2002 was 480 million
board feet per year (DNR 2004). The DNR is currently developing long-term sustainable
harvest calculation alternatives for eastern Washington for submission to the
Board of Natural Resources for review in the next biennium.
3.3.2. HCP Amendment
The DNR recently submitted and was granted an amendment from the federal government
to the state HCP for three sub-landscape areas in the Klickitat Planning
Unit within the SE administrative region (Yakima and Klickitat Counties).
Because of serious forest health problems in this area, it was determined
that habitats for the northern spotted owl were in jeopardy and that new
management approaches were needed. Following two years of consultation, a
modified, ecologically sound, and operationally feasible strategy was agreed
upon whereby the DNR would employ selective harvest activities to protect
and restore northern spotted owl habitats. An increase in annual harvest
volume of 20 -30 million board feet per year for 5 to 7 years is anticipated
as a result. A large portion of this harvest volume may be comprised of smaller
diameter trees from suppressed stocks (DNR 2004).
3.3.3. New Harvest
Flexibilities
The traditional state timber sale arrangement involves the auction of cutting
rights to standing timber within a defined boundary. The winning bidder is
responsible for the removal of the timber. In 2004, the Washington State Legislature
passed into law SB 6144. SB 6144 states that the DNR may initiate contract-harvesting
activities and silvicultural treatments for the purpose of improving forest
health. SB 6144 creates a contract-harvesting revolving account; expenditures
from which may be made by the DNR for payment of harvesting and silvicultural
treatment costs necessary to improve forest health. Upon completion of timber
removals, decked logs are then sold to the highest bidder at auction. The revolving
account is reimbursed from the proceeds of any log sales that develop from
these activities. Net revenues in excess of costs are then distributed to trust
beneficiaries. The DNR may retain 25% of net revenues to cover administrative
costs. This new law enables the DNR, for the first time, to undertake forest
health projects with some opportunity for cost recovery; where otherwise the
timber removal costs might have been prohibitive (Washington State Legislature
2004). It is anticipated that forest health activities may generate a harvest
volume of 30 million board feet per year in addition to the regular timber
sale program. Many trees harvested to promote forest health will be smaller
diameter suppressed stock.
3.3.4. Marketing and
Sales
For the last several years the DNR marketing and sales department has been
developing new ways to improve effectiveness of timber sale offerings. There
is increased emphasis on the recognition that timber purchasers are valuable
DNR customers. A service-oriented focus has been established to better serve
purchaser needs. Aggressive promotional strategies have been employed both
in state and out of state such that an increasing number of potential purchasers
are being made aware of DNR timber sale opportunities. Improvements are evidenced
by increased operational efficiencies, reduced costs, and improved returns
to the trust beneficiaries (Tweedale 2004, Independent Review Committee 2004).
Marketing changes include the shortened contract lengths for some sales, increased
pole sales, management of wood flow timing to the market, and contract harvesting
to provide different product mix availabilities. These innovative marketing
approaches have received praise by timber purchasers, the Board of Natural
Resources, and the Independent Review Committee to the Commissioner of Public
Lands. However, continuous quality improvement of a marketing program (Walton
1986) with flexibility to accommodate shifts is product volumes, types, and
customer needs requires ongoing informational assessments and strategic re-evaluations.
An adaptive operational framework is needed and periodic consideration of multiple
dynamic influences at many scales is required. For the DNR to increase harvest
activities, additional personnel will be needed to replace retirees and to
expand operational capabilities. Timber volumes to become available for the
statewide DNR harvest as a result of recalculation of the sustainable harvest
target on the west-side, modifications to the HCP in the SE region, and forest
health activities in NE and SE are expected to increase available regional
timber supplies by 100-150 MMBF per year. Continued sensitivity to purchaser
preferences and innovative approaches to timber offerings will help to insure
that DNR timber sales attract aggressive bidder interest and produce maximum
economic return to trusts.
3.3.5 Shrinking Resources
The complexities and costs of managing forests have increased dramatically
for the DNR in the last two decades but revenue returns in real dollars from
harvest activities have dropped well below historic averages. Additional
trained natural resource management professionals are needed to expand the
present workforce to meet increased harvest targets and to replace the current
wave of “baby-boomer” retirees. Recent DNR reports suggest that
the current management fund deduction of 25 percent of gross timber sale
receipts is inadequate to address current work load and human resources challenges.
If adequate funding is not available to plan, prepare, and implement forest
health and other timber management activities then future harvest volumes
and trust revenues will fall short of projections. At stake are millions
of dollars of trust revenues, increases in older forest habitats, improvements
for spotted owl populations, and protection of riparian resources (Aust 2004,
Independent Review Committee 2004).
3.4 Historic Changes in Federal and State Harvest Volumes
Dramatic changes in forest management occurred in the Pacific Northwest throughout the 1980’s and 90’s. Concerns about species habitats and old growth protection resulted in court injunctions and policy shifts that caused abrupt reductions in timber harvests from federal forest lands. In 1988, the timber harvest from National Forests in Washington State was 1.5 billion board feet. In 2002, the federal harvest in Washington was 72 million board feet; less than 5% of the 1988 level. Timber harvest levels were reduced on DNR forestlands from 826 million board feet in 1988 to 457 million in 2002; a 45% decline. Lumber and log prices experienced volatile spikes and drops during this period. Unable to respond to such rapid changes, many forest products companies ceased operations. Current public concerns over forest health and habitat restoration, however, now appear to be prompting new management approaches on both federal and state forestlands that may result in increases in harvest activities and saleable log volumes for the first time in more than a decade.
3.5 Adjustments to Infrastructure
3.5.1. Smaller Logs
As a result of dramatic drops in public timber harvests, during the period
from 1988 to the present, many sawmills, pulp mills, and veneer mills in
the Pacific Northwest, unable to secure sufficient log supplies or to respond
to rapidly shifting markets, closed operations. Paul Ehringer, long-time
industry consultant, reports that 378 mills closed in the region during the
period from 1989 to 2002 (Pease 2003). However, the consequences were more
profound than closed businesses and lost jobs; a total restructuring of the
forest products industry occurred. Many surviving mills retooled for small
diameter logs and higher production outputs. Perez-Garcia (2004), in an investigation
of changes to the Washington lumber manufacturing sector, found that many
of the mills that closed were operations with smaller production capabilities
(less than 30 million board feet annually) while there was little drop in
the number of mills with capacity for large annual production volumes. Mill
surveys from the DNR, the Forest Service, and Random Lengths provide similar
reports (Larsen 2003, 2000, 1998, Spelter et al. 2001, Spelter 2002, Random
Lengths 1988 & 2004). Larger mills survived and smaller mills closed.
Some large mills actually increased levels of production. The implications
of these infrastructure adjustments are likely to be lasting. Most of the
remaining sawmill capacity has focused on the high-production manufacture
of second growth logs available from private forests with a maximum large
end diameter of 20 - 24 inches and a minimum small end diameter of 6 inches.
Little production of the valuable high grade clear lumber that comes from
larger logs remains (Warren 2004). Subsequently, price premiums for large
logs disappeared as did many markets for specialty Northwest lumber products
(Wagner 2003). Industrial timber managers responded by shortening harvest
rotations to produce uniform second growth logs most in demand.
3.5.2. Four Billion
Board Feet
While the volume of public timber harvest fell off sharply, the number of forest
products manufacturers declined, and 10,000 forest products workers lost their
jobs in Washington, the total volume of lumber production gradually increased
with an average of about 4 billion board feet per year (Blatner et al. 2003,
Warren 2004). The state of Washington set a post World War II sawmill production
record in 2003 with 4.9 billion board feet of lumber produced for that year(Western
Wood Products Association 2004). There are several reasons why this happened.
Regulatory and market changes resulted in reduced log exports making more logs
from state and private forests available to domestic processors. Mills that
retooled for efficient utilization of smaller diameter logs experienced higher
production and improved log-to-lumber recovery ratios through reduced saw kerf,
increased wane allowances, curve sawing innovations, and other manufacturing
modernizations. An overall gain in capacity was achieved as remaining mills
offset capacity losses through capital investments in production improvements
(Spelter 2002). In 2003, sawmills producing more than 100 MMBF per year account
for more than 64% of regional sawmill production, whereas in 1988, mills with
such large capacity accounted for only 38% of total production (Western Wood
Products Association 2004) . Some industry analysts predict that recent price
increases connected to strong housing demand and anticipated increases in log
availability will result in future investment in new sawmill capacity in Washington
(Perez-Garcia 2004).
3.5.3. Tributary Areas
By the late 1990’s the Japanese economy went into decline and log export
volumes dropped off making more logs available from private forests for domestic
process. As the number of mills declined but average capacity increased, the
haul distance from logging site to mill increased (Perez-Garcia 2004). Logs
not only traveled across state lines but logs were imported from other countries.
In 2002, more than 400 million board feet of logs was imported from British
Columbia for Pacific Northwest Mills (Warren 2004). Historic understanding
of log-to-mill tributary areas as defined by a distance radius from the mill
site would appear to be no longer applicable.
3.5.4. Panel Products
While region sawmill volume of production has remained stable, this has not
been the case for other forest products manufacturing sectors. The plywood
industry in the west lost 54% of capacity during the years from 1990 to 2004
and projections indicate that capacity decline will continue into the future
at rates higher for the west than for the rest of the United States (Adair
2004). Reduction in public forest harvests limited the volume of old growth
timber that was available to plywood producers resulting in declining quality
of panel production. As a result, end-use markets have become indifferent
to product differences between western plywood and plywood produced from
southern pine. Market share shifted to the southeast and the plywood industry
is expected to continue to decline in the Pacific Northwest (Adair 2004).
Coincident to these dynamic changes, production of oriented strand board
(OSB) increased throughout North America further eroding market share of
western plywood. OSB can be manufactured from small diameter low quality
logs and OSB markets have increased dramatically in recent years, claiming
more than 50% of the structural panel market (Haynes 2003), yet there are
currently no OSB manufacturing facilities in the western United States (Adair
2004).
Particle board and medium density fiberboard (MDF) are wood-based panel products that have taken market share from plywood for some applications such as underlayment. These products are generally made from sawmill residues and wastes that are unsuitable for pulping such as planer shavings, dried trim, and sander dust. These residual materials provide an inexpensive source of fiber that is less costly than round wood. Three particleboard facilities and one MDF plant currently operate in the west. All of these products utilize waste fiber making the use of round wood generated from forest thinnings an unlikely raw material for the manufacture of particle board or MDF (Spelter et al. 1996).
3.5.5. Engineered Wood
Products
Large log scarcities created by federal harvest reductions helped to spur market
entry of engineered wood products as replacement alternatives for wide dimension
lumber and structural joists and beams. Structural engineered wood products
(EWP) include glulams, wooden i-joists, oriented strand lumber and laminated
veneer lumber (LVL). A subsequent reduction of market premium for larger dimension
solid wood products has been the result. One manifestation of this value shift
is likely a permanent reduction in price premium for larger logs. EWP markets
are projected for continued upward growth (Adair 2004). There are currently
12 EWP producers of structural products in Oregon, 3 in Washington, and 3 in
Idaho.
3.5.6. Pulp and Paper
In recent years, the pulp and paper industry has experienced reductions in
the number of operating mills in the Pacific Northwest. Between 1989 and
2001 the number of pulp and paper mills in the Pacific Northwest dropped
from 35 to 23 (Gammel 2004, Center for Paper Business and Industry Studies
2004, Lockwood-Post’s Directory 1988 & 2003). Dramatic declines
in production capacity accompanied reductions in the number of operating
facilities. In 1988, there were 26 pulp and paper mills operating in Washington.
By 2003, the number of operating pulp and paper mills was reduced to 15 accompanied
by a 45% reduction in domestic production and a 71% reduction in exports.
Most remaining capacity is located in western Washington. There are presently
3 pulp and paper mills operating in eastern Washington. While problems for
the domestic pulp and paper industry may be toughest on companies in the
Pacific Northwest; flat product prices, strong international competition,
and high production costs have resulted in cuts in capitol spending for the
pulp and paper industry throughout the United States that in recent years
have fallen below the point required to maintain facility competitiveness
(Kinstrey 2004). Kraft pulping is the dominant pulping technology used in
the United States and worldwide. However, kraft pulping is extremely capital-intensive.
Newly constructed mills cost in excess of $1 billion and must process between
1,000 - 2,000 tons of dry wood chips per day to be economically viable (Youngquist
and Hamilton 1999). No investments in new capacity for the Pacific Northwest
are anticipated and future closures of existing facilities may occur (Lockwood-Post’s
Directory 2003).
3.5.7. Global Demand
An estimate of the range of increase in future global demand for wood fiber
over the next 50 years was developed by Perez-Garcia in 2003 using the Center
for International Trade in Forest Products (CINTRAFOR) Global Trade Model
(CGTM). Projections were based upon a 0.5% annual rate of increase, reflective
of the rate of change from 1990-2000, and a 1.4% annual rate of increase,
reflective of rate of change prior to 1990. The annual rate of growth in
the gross domestic product (GDP) was assumed to average 3.5%. (Perez-Garcia
2004, Perez-Garcia 2005). International consumption was estimated to reach
between 353 billion board feet (BBF) and 499 BBF annually by 2050. The US
is the largest market for softwood lumber in the world and is expected to
remain so during the projection period. Perez-Garcia estimates that the US
West would respond to rising demand by increasing the regional harvest level
by 1.8 BBF per year by 2050. Such a volume increase would suggest a need
for new capacity expansion for the US West Region of 7 to 8 large production
mills or approximately 60 smaller production mills. The implications for
needed regional infrastructure adjustments for pulp and paper production
were not examined.
3.5.8. Labor Availability
At the local level a key issue is the availability of sufficient skilled labor
and appropriate harvest equipment. At issue as well is the proximity of workers
and machinery to areas where work needs to be done. If forestry companies
are required to move personnel and equipment large distances costs will be
high and competition reduced. Due to reductions in public timber harvests
the availability of skilled forestry workers in the western U.S. has declined
to an estimated 6.4 forest workers per 100 square miles. By comparison the
U. S. South is estimated to have 15.4 forest workers per 100 square miles
(Rummer et al. 2003). Sufficient numbers of resource management personnel
to administer agency programs are also in short supply (Renewable Natural
Resources Foundation 2003-4). See also Section 3.7.5, Disappearing Workforce,
in this report.
3.6 Changes in Markets for Forest Products
3.6.1. High Production
Costs
The relative increasing costs of regulations, labor, energy, and transportation
complicated by the strong value of the U.S. dollar have made the Pacific Northwest
a high cost region for the production of wood and wood fiber products as compared
to other areas of the world (Wood Markets Monthly 2002, Haynes 2003). After
15 years of dramatic reductions to regional log supplies, proposed harvest
volume increases for forest health and habitat restoration may occur at a time
when reductions in industrial infrastructure, increased global fiber competition,
high production costs, and uncertain markets leave the Pacific Northwest poorly
positioned for rapid response. Fortunately, record housing starts in recent
years have translated to price increases for saw logs while future decline
of the dollar against other currencies is projected to result in increased
access to export markets and less competition from Canadian producers (Aust
2004). An emerging demand for North American wood to provide building materials
for a fast growing China economy may add to increases in the value of Washington
timber (Aust 2004). Strategies for maximizing timber sale effectiveness will
need to consider the interactions of such multiple and dynamic market influences.
3.6.2. Attractive State
Timber
With the decline of the federal timber sale program, the DNR has become the
dominant source of publicly available timber supply within the state. The DNR
typically manages its forests for longer rotations with less intensive efforts
to maximize growth than industrial forest landowners and subsequently produces
finer grained saw logs that are attractive to purchasers. Another positive
development for timber sales, which has served to broaden the purchaser pool,
has been the increased use of rail and water freight to transport logs further
from the woods to the mill. The DNR marketing and sales department has new
programs to capitalize on such opportunities by focusing timber sales offerings
to best suit a range of customer needs. The result has been heightened competition
amongst bidders for timber sales and the DNR timber sale program has benefited
(Independent Review Committee 2004).
Over the past ten years, timber producers in the Pacific Northwest have witnessed significant downturns in prices for some log types. This has been particularly true for logs 30 inches and larger in diameter (Wagner et al. 2003). Today few Washington mills want large high grade conifer logs. Log Lines, a regional log price reporting service in Mount Vernon, WA, stopped publishing market prices for Douglas-fir peeler grades in Washington in 1994 (Log Lines 2004). Log prices for Douglas-fir peeler logs, however, are reported for the coast and Williamette areas of Oregon where mills still secure and manufacture large diameter logs. Prices for large diameter logs are lower than they have been for ten years. When an inflation-adjusted price comparison is made between what Oregon mills would pay for Douglas-fir peelers in 1994 verses 2003, reductions in available market prices for peeler grades are more than 50% (see Table 3.1). Similar market adjustments have occurred for large diameter logs of other species. The price for Ponderosa pine number one saw logs also dropped by 50% between 1994 and 2002 (Wagner et al. 2003).
| Table 3.1. Price changes for Douglas-fir peeler logs in the coast and Williamette regions of Oregon in $/MBF (Log Lines 2004, US Department of Labor 2004). |
Grade
|
1994 price
|
Inflation adjusted; 2003 $
|
2003 price
|
Change (reduction)
|
| 1 - P | $1,978
|
$2,451
|
$1,123
|
-55%
|
| 2 - P | $1,718
|
$2,133
|
$916
|
-57%
|
| 3 - P | $1,314
|
$1,631
|
$672
|
-59%
|
Other factors combine to further erode the market value of high-grade large diameter logs from Washington. Recognition by private (especially non-industrial) forest landowners that large log prices could continue decline may mean that private landowners liquidate remaining inventories of older larger trees to avoid risk of future low prices. As private forest landowners cease the offering of larger diameter logs, further reductions of processor infrastructure and market prices can be anticipated. In 2002, logs from private forestlands accounted for 76% of the total annual harvest in Washington and 85% of the total harvest in Oregon. By comparison, in the same year, annual harvest volumes from state-owned forestlands in Washington (DNR) accounted for only 13% of the total in-state harvest and in Oregon (ODF) only 7% of the total in-state harvest (Warren 2004). Many of the large logs harvested from DNR and other forests in Washington are sold into Oregon markets. When Washington logs are sold to Oregon buyers, the negotiated price must reflect a discount needed to absorb high transportation costs. There are other factors that serve to further compromise prices for large logs. Domestic and export market shares for some high-end lumber products historically produced from large Pacific Northwest logs have been lost to Canadian imports, Southern pine, and product alternatives. The Asian recession has negatively impacted Washington clear lumber export volumes and prices. This is especially true for white wood markets that have historically been dominated by Asian customers.
Price information for large higher quality logs in the Pacific Northwest, where markets are available, indicates that for Douglas-fir, western hemlock, and ponderosa pine, real log prices have dropped to the lowest level in 25 years. The trend towards increased utilization of small-diameter logs is expected to result in continuing price declines for large diameter tight-grain logs (Aust 2004). Wagner et al. (2003) interviewed 18 timber processors in Oregon and Washington that can still handle large diameter logs and found, while most of them have specialized in distinct niche markets (export clears, crossarms, specialty panels, etc.) for the lumber yields from large logs, that only 6-7 of current Oregon processors of large logs will likely continue in this market into the future. About half of large log purchasers in Oregon reported that log supplies were readily available while the others reported log scarcities. Large log processors are hauling logs much farther distances than historically has been the case. Log buyers reported that sawlogs (smaller coarse grain) are hauled by truck up to 150 miles, while peeler logs (larger fine grain) are being hauled up to 400 miles by truck. Distances can be much greater if logs are transported by rail or water.
3.6.4.
Clear Lumber
While Pacific Northwest market share in Japanese post and beam construction
has diminished due to housing start declines, an increased emphasis on quality,
and competition from Canadian and European lumber and laminated products, some
opportunities remain for sales of high quality lumber products into this market
especially for western hemlock, Douglas-fir, and true fir species. European
countries such as Italy and Spain also purchase Douglas-fir clears. As the
dollar weakens, these export markets are expected to strengthen. Domestic markets
for clear fine grain lumber products from large Ponderosa pine, western hemlock,
and Douglas-fir logs include doors, windows, and molding. While some market
share for these products has been lost to product alternatives such as composites
and plastics, high quality architectural applications still provide stable
albeit reduced demand. Strong competition from Canadian suppliers, however,
has had a dampening effect on market prices for clear lumber products from
the Pacific Northwest.
3.6.5.
Beams and Timbers
A select market still exists for large architectural solid wood beams and pillars
where customers demand products more aesthetically attractive than laminated
beams. Solid wood timbers are typically more cost competitive than laminated
beams when dimensions are 6x10 or smaller. Domestic lumber products from large
logs also include crossarms and crossties. The market for crossarms (used by
public utilities and sometimes called transmission arms) is large and steady
while providing a premium price due to the small knot and strength requirements
for this product. Crossties are lower grade large timbers used on railroad
lines. There are about 750 million ties in service nationwide. Of those, 16
million ties were replaced in 2001. While the market is large, the price is
low for crossties and laminated wood products have made market inroads for
some railroad applications.
3.6.6.
Poles
Utility poles are premium-priced whole log products made from moderately large
trees that are straight with little taper and can produce long logs (often
100 feet or more). Across the nation, there are 165 million wood utility poles
in service and 2-5 million poles are replaced annually. In the Pacific Northwest,
the highest value log return is from sales of utility poles. Some forest land
owners market standing timber suitable for utility poles independent of general
timber sale offerings.
3.6.7.
Saw Logs and Dimension Lumber
Currently sawmills in the Pacific Northwest consume logs that are predominantly
softwood species and average 11 inches in diameter with a minimum of 6-8 inches
and maximum of 24 inches in diameter depending upon mill equipment and location.
Logs are generally milled to produce a mixture of dimension lumber, studs,
chips, and other residuals. Prices for logs of this type are sensitive to conventional
market influences such as interest rate changes, housing starts, and short
term supply and demand fluctuations. Although average saw log prices have not
fallen as dramatically over the last ten years as have the large log prices,
inflation adjusted price reductions have been over 30% for most species and
grades (see Tables 3.2 – 3.4). However, Haynes et al. (2003) projected
these markets to remain stable with some upward trend far into the future based
upon assumptions of increasing consumer demand for building products. The Economic
and Revenue Forecast (Aust 2004) produced by the DNR shows slight upward price
trend through the end of the decade. The majority of the harvested timber volume
from DNR lands is and will be softwood logs suitable for dimension lumber production.
While total lumber production volume in contrast with most other aspects of
the forest products industry has remained relatively stable in Washington state
for the last decade, there has been a shift in where the lumber is produced.
Warren (2004) cites data from the Western Wood Products Association that indicates
that the inland production has declined by 13% during the period from 1994-2002
while the coast production increased by 39% during the same period. Recent
sales of Boise Cascade Corp. mills and land suggest that declines in the inland
west milling capacity may not be over (Dietz 2004). In contrast, new milling
facilities in western Washington are being planned or have been recently constructed
(Aust 2004).
| Table 3.2. Price changes for Douglas-fir (DF) and whitewood (WW) sawlogs in western Washington in $/MBF (Log Lines 2004, US Department of Labor 2004). |
| Species & Grade | 1994 price
|
Inflation adjusted; 2003 $
|
2003 price
|
Change
|
| DF #2 Saw logs | $586
|
$728
|
$457
|
-37%
|
| WW #2 Saw logs | $447
|
$555
|
$316
|
-43%
|
| Table 3.3. Price changes for Douglas-fir (DF) and whitewood (WW) Chip & Saw 5”+ in western Washington in $/MBF (Log Lines 2004, US Department of Labor 2004). |
| Species & Grade | 1994 price
|
Inflation adjusted; 2003 $
|
2003 price
|
Change
|
| DF Chip & Saw | $500
|
$621
|
$404
|
-35%
|
| WW Chip & Saw | $350
|
$435
|
$209
|
-52%
|
| Species & Grade | 1994 price
|
Inflation adjusted; 2004 $
|
2004 price
|
Change
|
| DF camprun | $480
|
$612
|
$460
|
-25%
|
| LP camprun | $476
|
$607
|
$375
|
-38%
|
| PP camprun | $522
|
$665
|
$450
|
-32%
|
| WW camprun | $448
|
$571
|
$360
|
-37%
|
3.6.8.
Log Sort Yards
Maximum returns from log sales are logically linked to the sale of distinct
log types to highest and best users. One method for adding value to logs is
to resort, remanufacture, and merchandize through a log sort yard. In response
to community and government interest in the economic development potential
of forest restoration, fuels reductions, and thinning projects, several studies
have examined the feasibility of sort yard operations to increase effectiveness
of timber merchandizing programs. Log sorting yards can provide timber sellers
with a number of opportunities to segregate logs by species and grade for highest
value return when landing sorting is too limited for quality-control merchandizing.
Camp run logs can be rebucked and graded in sort yards for improvements in
quality and scale. Some log customers will pay higher prices for log decks
of known quality that are available on demand. Log customers may pay a premium
for log yard services such as debarking or reloading for water or rail freight.
Log yard residuals such as bark, chips, and rock can be recovered to help defray
operations costs. Log customers may pay a premium for sorted logs in order
to avoid risks associated with uncertain qualities and costs that result from
timber sale purchases. Several studies have examined the operational and economic
feasibilities of log sort yard operations (Dramm et 2002, Dramm et al. 2004).
Log sort yards have been used successfully throughout North America but both
of the studies cited in this report stress cautionary conclusions. Government-operated
log yards have had limited success and only in Canada where 75% or more of
handled log volume was higher quality saw log through peeler grade material.
Log yards were found to be not practical for handling small diameter or low
value material. If the logs are used primarily for high value log types then
the minimum annual volume necessary to profitably operate a log yard is suggested
to be 10 million board feet but can vary considerably depending on the operational
costs and net return margins (Dramm 2004). With the decline of log exports
and old growth harvests, the number of log sorts needed for most harvest activities
has decreased along with the value differential between log grades and the
subsequent operational attractiveness of sorting yards.
3.6.9.
Small Diameter Wood
Of growing contemporary concern in the Pacific Northwest are the volumes of
very small diameter low value logs not generally considered large enough for
sawmill production that must be removed to reduce hazardous fuel loads. Many
mills have shifted raw material needs towards smaller logs than may have been
used a decade ago, however, most still do not want logs smaller than 8 inches
in diameter. Barbour (1999) in a sawmill recovery study of 8 foot long small
diameter logs found that logs five inches in diameter and logs ten inches in
diameter require the same process time per piece in the sawmill but the production
difference for the two log sizes was huge. To produce one thousand board feet
of lumber it took 160 five-inch diameter logs but only 31 ten-inch diameter
logs. The production for an eight hour shift was 65 MBF for five-inch logs
and 336 MBF when ten-inch logs were run. In northeast Washington, however,
there are several mills that have installed special equipment expressly for
the purpose of manufacturing dimension lumber and chips from smaller logs that
may range from 3-8 inches in diameter with an average of 5 inches. Ironically,
these mills struggle to secure sufficient raw material (Petersen 2004). The
DNR should have no difficulty selling small logs in NE Washington where infrastructure
is well established.
In other areas round wood pulp markets exist that can absorb small diameter volumes albeit with marginal economic benefit to the seller depending on haul distance and current market price. Transportation is a critical factor in small diameter harvest costs calculations (Han et al. 2002). Where rail lines are close to harvest activities there can be critical savings on freight charges. In many areas of eastern Washington, however, haul must be by truck and the subsequent cost of freight to pulp and paper mills and sawmills is prohibitively expensive for low value logs.
Pulp log markets have experienced dramatic price reductions during the last decade. Current pulp log prices are lower than estimated harvest costs. The removal of smaller diameter timber has been shown to be net cost when logs are less than 8-9 inches DBH (Kluender et al. 1998, Wagner et al. 1998). The negative value-to-cost relationship of small diameter pulp log removals demonstrates the need in some eastside forests for innovative approaches to reduce forest fire risk while retrieving maximum value from harvested trees.
There have been a number of publicly and privately supported research and demonstration projects designed to explore alternative utilization strategies for small diameter logs resulting from fuels reduction projects. Innovative small log products have been developed that include habitat structures, fencing, erosion controls, veneer, log furniture, post and pole construction materials, and animal bedding. While there have been some successful local projects with resultant economic development benefits for rural communities, as yet none of these projects have resulted in establishment of new log markets that have successfully increased the market value of small diameter logs (Lincoln Industrial 2004, Livingston 2004, Al-Khattat 2002, Dooley 2002, Eckelman and Haviarova 2002, Kamarata 2002, Paun and Wright 2001, Paun and Jackson 2000). If a mixture of log types and sizes are removed during a harvest or forest restoration treatment, the overall return from the harvest activity can be positive. Integrated harvest strategies that combine removal of some larger sawmill material with the less valuable small diameter fuel loads have been shown to produce both positive ecological and economic results (Barbour et al. 2004, Fielder et al. 2001).
| Table 3.5. Price changes for Douglas-fir (DF), and whitewood (WW) pulp logs in western Washington in $/MBF (Log Lines 2004, US Department of Labor 2004). |
1994 price
|
Inflation adjusted; 2003 $
|
2003 price
|
Change
|
|
| Douglas-fir | $199
|
$247
|
$99
|
-60%
|
| whitewood | $189
|
$235
|
$83
|
-65%
|
| Table 3.6. Estimated average harvest and haul cost in $/MBF for eastern Washington small diameter forests by equipment type (Chandler. 2004, Han et al. 2002). |
Ground Based
|
Cable
|
Helicopter
|
$160-200
|
$195-235
|
$325-375
|
3.6.10.
OSB and LVL
Spelter et al. (1996) examined key performance parameters of various processing
alternatives for small diameter timber (4 to 8 inch small end diameter) from
forest health thinning treatments. Oriented strand board (OSB) and laminated
veneer lumber (LVL) were two engineered wood products that offered respectable
returns on investment. However, returns from LVL diminished appreciably as
diameter size decreased below 8 inches. Depending upon average diameter of
raw material supply, annual volumes of timber needed as raw material supply
for either product manufacture ranged from 60 to 100 million board feet. Capital
investment in plant construction was estimated to be $100 million for OSB and
$65 million for LVL.
3.6.11.
MSR Lumber
Returns from stud and random length lumber production from small diameter timber
were found to be marginal but could be increased with addition of machine-stress-rating
(MSR) capability to sort lumber for value-added applications such as trusses
and laminations. Because of dense stocking and slow growth many trees to be
removed in eastern Washington may produce lumber with the desirable strength
properties needed for high value strength applications. In a study of small
diameter timber in Northern Idaho, Erikson et al. (2000) found that machine-stress-rating
of lodgepole pine lumber production produced a $27/MBF increase in overall
lumber value and MRS grading of grand fir produced a $15/MBF increase in overall
lumber value above visual grading. Minimum annual raw material supply required
for efficient lumber production from small diameter logs was found to be 70
million board feet. Capital investment for small log sawmill construction was
estimated to be $30 million. MSR capability can be added to existing sawmill
production at an estimated cost of approximately $750,000.
3.6.12.
Acoustic Resonant Testing
Fibre-gen, a division of the New Zealand firm, Carter, Holt, Harvey, has been
working with American scientists at the USDA Forest Products Laboratory to
develop field tools that utilize acoustic resonant frequencies to measure timber
stiffness in the log or at the tree. There is growing recognition amongst producers
of MSR and LVL that wood stiffness is a key element in log valuation. For example,
depending upon grade, MSR lumber can bring a price premium of $65 to $98 per
MBF beyond wholesale value of 2x4 random length standard and better lumber.
An opportunity may soon exist for log sellers to receive premium prices for
logs that test well for stiffness. Stiffness testing tools are hand held and
can easily be used in the log yard as part of scaling or in the woods as part
of the timber cruise.
3.6.13.
BCTMP
Spelter et al. (1996) suggested that conversion of pulpwood for bleached chemithermomechanical
pulp (BCTMP) might hold promise as well. While BCTMP plants can operate successfully
with raw material supplies as low as 25 MMBF per year, the investment to net
income ratio was much higher than other manufacturing alternatives indicating
greater risk and longer time to recover capital investment. Estimated capital
cost for BCTMP plant construction was $80 million.
3.6.14.
Panels
Production of particle board and medium density fiberboard was examined and
found to be reliant upon an inexpensive raw material supply from residues and
wastes from sawmills and plywood plants. Production of particle board and medium
density fiberboard was determined not feasible from small diameter timber.
Plywood manufacture requires larger log sizes and was also found to be an unsuitable
utilization strategy for small diameter materials.
3.6.15.
Composites
Another emerging product group is wood-plastic composites (WPC). Development
of WPC technology is not new. The Washington State University Wood Materials
and Engineering Laboratory has been successfully developing wood composite
applications for more than fifty years. Wood composite applications for siding,
decking, molding, and roofing products are expected to capture 20% of their
respective markets by 2005. WPC is composed of 50-70% wood flour and 30-50%
plastic. The wood flour in WPC is produced from sawdust, shavings, and other
wood products manufacture residuals (Clemons 2002). Another composite wood
product that has experienced steady market growth for the last decade is the
manufactured firelog (Shook 1999). Firelogs are generally made from compressed
planer shavings and wax. Wood pellets are also compressed wood fuel products
made from sawmill residuals.
3.6.16.
Small Log Availability
Regardless of manufacturing strategy, critical for consideration for private
investment in new capacity is the amount of fiber availability and the haul
distance from the woods to the mill. A study, undertaken by forest managers
and scientists from Oregon State University, Oregon Department of Forestry,
U.S. Forest Service Pacific Northwest Research Station and the Wallowa-Whitman,
Malheur, and Umatilla National Forests, to assess timber availability from
forest restoration projects on more than 1.6 million acres in the Blue Mountains
of Oregon estimated that, while small diameter timber (in this case less than
7 inches in diameter at breast height) may comprise many of the stems in at-risk
forests, the actual volume to be removed is less than 3% of the total log yield
resulting from hazardous fuel removal harvests (OSU and others 2002). An assessment
of forest inventory from Continuous Vegetation Survey (CVS) plot data for the
Okanogan National Forest showed that while trees less than or equal to 6 inches
diameter at breast height (DBH) accounted for 90% of the stem count such small
diameter trees comprised only 2% of the total volume (Mason et al. 2003). If
similar distributions of trees by size class are consistent for DNR forests
in eastern Washington, the subsequent available harvest volumes of small logs
from state lands would be too small to warrant private investment in any of
the manufacturing options investigated by Spelter et al. The only forest land
owner in eastern Washington with sufficient volumes of standing small diameter
timber to warrant private investment in new manufacturing capacity is the USDA
Forest Service.
3.6.17.
Biomass-to-Energy
Hazardous fuel loads from overstocked forests to be removed to reduce risk
of forest fires include many small diameter logs, tops and limbs. When markets
have been strong, there have been opportunities to economically utilize some
of this material as pulp. However, pulp markets are currently weak, forest
biomass from tops and limbs is unsuitable to produce clean chips for pulp,
and, for many areas of eastern Washington, pulp and paper mills are prohibitively
distant from the woods. New consideration is being given to the potential utilization
of surplus forest biomass as a clean and renewable alternative to fossil fuels
for the generation of energy. A number of recent studies have examined the
potential for the utilization of otherwise non-merchantable round wood and
forest harvest residuals as feed stock for energy conversion plants (Graph
and Koehler 2000, Sampson et al. 2001, Han et al. 2002, Antares Group Inc.
2003, McNeil Technologies Inc. 2003, Rummer et al. 2003, USDI Bureau of Land
Management and USDOE National Renewable Energy Laboratory 2003). In addition
to non-merchantable materials resulting from harvest activities, other sources
of woody biomass could include stems taken from pre-commercial thinning in
young forests and by-product residuals from forest product manufacturing operations
such as shavings and saw dust.
3.6.18.
Biomass Supply
Total logging residues have been observed to be 7.9% of harvested saw log volumes
(McClain 1996). Interviews indicate that if the delivered price paid for biomass
is less than harvest and haul expenses limited quantities of this fuel will
be available from privately managed forestlands (TSS Consultants 2002). Saw
mill biomass from trim and side-cut has been estimated to average 14.6% of
total harvested saw log volumes, however, 12% of this volume can be utilized
as clean chips which bring a more valuable return than biomass for feedstock.
The remaining 2.6% would be available for use as fuel (Keegan et al. 1997).
However, many mills burn this biomass on-site to generate energy and heat for
internal use. Future volumes of biomass will develop from thinnings in regenerated
public forestlands but volumes and temporal availability are problematic to
estimate. While important for consideration in long-term forest plans, these
future forest biomass supplies grown from currently regenerating forests are
likely to become available (20 plus years) only after potential investment
in cogeneration capacity would have been fully amortized. Addition of nonforest
biomass feed stocks from other sources such as agricultural and municipal waste
could increase estimated generating capacity by several times and may reduce
overall fuel costs. A rule of thumb for investor confidence in the financing
and development of biomass power plants is that fuel availability must be 2
to 3 times the volume of fuel necessary to sustain a new biomass plant (TSS
Consultants 2002). While public interest in biomass-to-energy appears to be
building, a secure, sufficient, and affordable biomass supply for energy generation
has yet to be identified.
3.6.19.
Biomass Cost
Another serious obstacle to investment in biomass-to-energy development has
been the cost of delivered fuels as compared to the wholesale value of generated
electricity. For every $5.00/bone dry ton (BDT) increase in the delivered price
of fuel, the cost of cogeneration production is increased by about $0.006 per
kilowatt-hour (kWhr). A feasibility study to consider the siting of a cogeneration
plant in Prineville, Oregon estimated that the current average delivered price
for a BDT of wood biomass is between $30 and $44 depending upon haul distance
within a maximum 50 mile radius (TSS Consultants 2002). At this delivered price/BDT,
biomass-to-energy fuel costs alone approach $0.04/kWhr. When the cost of fuel
is added to the fixed and variable costs of facilities operations with an expected
rate of return, a base load power sales contract at $0.096 – 0.103/kWhr
would be needed to cover project costs of a biomass-to-energy project. Projects
with production of less than 50 megawatts (MW) would have higher production
costs (Emergent Solutions and Christopher Allen & Associates 2003). Current
power sales contracts for base load plants range from $0.025 to $0.04/kWhr.
A wholesale electricity market analysis indicates that with addition of “green
tag” and federal tax credit programs for renewable energy projects, the
highest currently available price is approximately $0.077/kWhr (Emergent Solutions
and Christopher Allen & Associates 2003). A US Department of Energy report
estimated that the cost of delivered logging residue to conversion facilities
in Washington would be $60-80/BDT, approximately twice the Oregon estimate
(Kerstetter and Lyons 2001). Recent feasibility studies in Oregon (McNeil Technologies
Inc. 2003) calculated the implied energy price based upon competitive pricing
for wood chips at $0.16/kWhr. These figures reveal that energy generated from
forest biomass and delivered to the power grid could currently sell for less
than the cost of delivered biomass fuel not including other conversion costs
such as labor, maintenance, depreciation, and amortization.
3.6.20.
Yakima Biomass-to-Energy Feasibility Study
A feasibility study was commissioned by the Yakima County Public Works Department
to review biomass opportunities and barriers in Yakima County, Washington (R.W.
Beck Inc. 2003). Located in Yakima County and nearby Klickitat County are significant
DNR forestlands that have been plagued by forest health problems as a result
of overstocking, species composition, insect outbreaks, and disease. The successful
establishment of a biomass-to-energy project in Yakima could provide benefit
to the DNR forest management program. Also in Yakima County are large areas
of tribal, private, and federal forestlands that have similar forest health
problems. Several large tribal and private sawmills are operating in the area
that produce residual wood waste. A private sawmill in the city of Yakima currently
burns 135,000 BDT of mill residues per year to generate steam for the plant’s
plywood kilns and dryers. In addition to accessible forest biomass and sawmill
residuals, there are substantial volumes of agricultural residues, urban yard
waste, and dairy industry manure that are locally available as supplemental
sources of feedstock. Utilization of these waste products would benefit the
county by reducing landfill use and mitigating the odor and environmental issues
associated with dairy and livestock wastes. Yakima County is also interested
in the economic benefits and job creation that a biomass project could offer.
On the surface, Yakima would seem to be a well-suited location for a successful
biomass-to-energy project, however, estimated cost of delivered forest biomass
in Yakima County was found to be $60 to $80 per BDT. Agricultural residuals
were only seasonally available and the handling logistics of dairy and municipal
waste were considered to be too costly. This investigation found that a biomass-to-energy
project could bring many benefits to Yakima County, but it also determined
that biomass fuels have low energy densities, collection and transportation
costs are high and that, while the technology for using biomass to generate
electricity is well established, the price paid for electricity does not offset
the cost of fuel and operations. Biomass can also be used for gasification
and production of biofuels. These processes may present better opportunities
to convert biomass to products of higher value than electricity and steam.
However, the Yakima study found that the technological and economic barriers
for all potential biomass conversion projects are currently too significant
to be profitably overcome.
3.6.21.
WA Biomass Utilization Infrastructure
Sawmill residues have been used to generate electricity and steam in Washington
for a long time. There are 38 facilities currently operating that combust about
3 million BDT of mill residues per year. All but two of these mill residue-to-energy
operations are owned and operated by the wood products companies that supply
the fuel. Mill residues are created on site as a by-product of profitable manufacturing
operations and subsequently are much less expensive than harvested, hauled,
and chipped forest biomass. However, evolving state and federal policies are
providing public investment dollars for biomass-to-energy projects which could
change the currently unfavorable economics of forest biomass utilization. A
study conducted for the Oregon Office of Energy (Sampson et al. 2001) suggests
that wholesale price supports of $.035 per kWh (low estimate) to $.09 per kWh
(high estimate) are needed to make bioenergy projects competitive with current
low cost sources of energy. Other studies have found similar cost relationships
(Antares Group Inc. 2003, McNeil Technologies, Inc. 2003).
Looked at differently, opportunities for forest biomass utilization are likely to produce other benefits. If small diameter forest fuels are considered as a waste disposal problem and hazardous fuels removals are considered as an investment in forest productivity, such as pre-commercial thinning, then public expenditures in forest health restoration are justified. Under such circumstances the cost of delivered biomass could be underwritten. Additionally, when removals of very small trees are undertaken as part of a revenue-generating commercial timber harvest activity, equipment and handling costs can be dramatically reduced and absorbed by associated revenue-generating saw log removal activities.
3.6.22.
DNR Market Challenges
The market and infrastructure challenges for the DNR harvest program that would
appear to be of greatest concern are the sale and utilization of the larger
and the very small diameter log yields. Fortunately for trust beneficiaries,
the yields of large and very small diameter logs appear to be a minority volume
of the planned total timber to be offered for sale. National lumber use is
near peak levels (Haynes et al. 2003), increases in consumption are anticipated
(Aust 2004), and the Pacific Northwest sawmill industry has stabilized following
a decade of upheaval (Perez-Garcia 2004). Projected increases in DNR harvest
levels represent a relatively small addition (less than 2%) to total available
Washington and Oregon timber supply. This volume is unlikely to cause substantive
market reaction. New sawmill capacity, predicted for the region, may in part
be because of increases in available state log supplies (Aust 2004). Imbalances
in the age-class distribution of private forest ownerships (Haynes et al. 2003)
may mean unique market opportunities for the DNR timber sales program if specific
log types can be offered to the right customers at opportune times. Aggressive
marketing approaches could provide small but potentially lucrative markets
for minority volumes of large older logs and other specialty log types. However,
the current poor economics of biomass-to-energy projects, the uncertainty of
regional small log volume (federal) availability, the high cost of production,
and the continuing decline of the Pacific Northwest pulp and paper industry
indicate that profitable utilization of small logs and sawmill residuals will
likely remain a problem. In the absence of federal harvest volume assurances
and infrastructure investment incentives, new industrial capacity to absorb
small diameter low value logs is likely not forthcoming.
3.7
Emerging Federal Forest Health Policies
3.7.1.
Healthy Forests Restoration Act
Following nearly twenty years of reductions to harvests from public lands,
today there appears to be growing consensus that increases in harvest activities
are needed for forest restoration and fire risk reduction. The DNR is implementing
such activities and increases to the state harvest program of 100 to 150 MMBF
per year are anticipated. In response to similar public concerns about declines
in forest health and increases in the incidence and magnitude of forest fires,
the U.S. Departments of Agriculture and Interior are attempting to increase
harvest activities on federal lands as well. In 2003, following several record-breaking
years of catastrophic fires in the inland West, Congress passed the Healthy
Forests Restoration Act. This historic law is intended to reduce the complexity
of federal environmental analysis and to give the Forest Service more flexible
contracting authorities to work with communities on fuels reduction projects.
A year later reliable estimates of future activities on federal lands remain
elusive. However, a recent Forest Service report entitled “A Strategic
Assessment of Forest Biomass and Fuel Reduction Treatments in Western States” (Rummer
et al. 2003) estimates that, if implemented, the needed fuel removals on accessible
ground from only high risk federal forests would constitute an increase in
available timber in the western United States of 25% of the current conventional
processing volume. Without increases in existing manufacturing capacity, market
impacts from increases in log availability of this magnitude could be large
and would be negative. This report goes further to suggest that about 75 average-sized
conventional sawmills would be needed for 30 years as new capacity in the region
to provide adequate processing facilities to utilize fuel reduction harvest
volumes. Another study (Haynes et al 2003) estimates that future thinning volumes
resulting from forest health harvests on public lands in the Western United
States could be roughly equivalent to raw material supplies needed for 28 new
wood pulp mills. Salvage harvesting of the 4-6 million acres of federal forest
that are consumed each year by forest fires could also add large timber volumes
to regional supplies. Haynes warns, however, that potential supply increases
in the absence of investment in infrastructure expansion will have profound
market implications. To date, in spite of growing public and Congressional
pressures, there has been little change in federal timber availability. Forest
Service harvests are infrequent and currently represent only 2% of the total
annual Washington timber harvest.
3.7.2.
Analysis Paralysis
A combination of factors serves to undermine implementation of large scale
federal forest health activities within the region. The federal project planning,
assessment, and review process is lengthy, time consuming and expensive following
which the likelihood of litigation from environmental groups is high (USDA
Forest Service 2002). A classic example of the paralysis that grips the federal
timber sale process might be the “Biscuit Fire” of 2002 that burned
400,000 acres of federal forest in Oregon. Fire fighting cost was $154 million.
The Biscuit Fire destroyed approximately 4.2 billion board feet of timber (Sessions
et al. 2004). Conservatively calculated at a low market value of $100/MBF,
stumpage returns from a timely salvage harvest would have equaled $420 million.
As of this writing, after two years of controversy and conflict, no timber
has been salvaged and much of the recoverable value has been lost to decay.
By contrast, in 2002, the DNR auctioned off the largest state timber sale in
history; a salvage sale of dead and dying timber. The sale preparation was
completed in four months. Losses to decay were minimized and the stumpage value
recovered by the DNR as trust revenue was $270/MBF (DNR 2002). Delay of harvest
in fire killed timber has been shown to result in substantial loss to timber
value due to decay (Parry et al. 1996, Lowell et al. 1992).
3.7.3.
The Empty Pipeline
Another important aspect of the lengthy federal planning process is that few
prepared timber sales are in the Forest Service “pipeline” for
the Pacific Northwest. For a sustainable timber sale program, a back log of
prepared timber sales ready for auction must be accumulated. Sales that are
sold today can only be offered as a result of planning that was initiated in
the past. Planning initiated today will be for sales to be sold at a future
date. The cumulative supply line represented by timber sales planned but as
yet unsold combined with timber sales sold and under contract but not yet harvested
is sometimes referred to in the industry as the “pipeline.” Pipeline
volumes represent the available timber supply by land owner type. The Forest
Service pipeline was emptied as a result of policy adjustments and court actions
through the 90’s that curtailed most harvest activity. Given the lengthy
and expensive planning process needed to prepare for Forest Service harvest
activity, restoration of a reliable federal timber pipeline would take years
perhaps decades to complete.
3.7.4.
No Bidders
A report prepared by Mater Engineering Ltd in 2002, found that on four Oregon
National Forests even when forest health timber sales were offered for auction
there was little bidder interest. In 2001, 42% of all small log sales that
were offered went unsold. Mater suggests factors that discouraged bidders might
be that logs were too small for existing infrastructure, the quality was poor,
the sales program sporadic, and the minimum acceptable bid price set too high
for existing market conditions. Elements of the Healthy Forest Restoration
Act are intended to correct this buyer/seller disconnect by giving the Forest
Service greater flexibility to negotiate contract arrangements. Timber sales
that attract no bidders are expensive evidence of how important seller/buyer
communication is to the success of a timber sale program.
3.7.5.
Disappearing Workforce
Another significant obstacle to preparation and implementation of federal fuels
reduction and harvest activities is the increasing shortage in federal agencies
of qualified professionals, such as entomologists and silviculturalists, because
of “baby boomer” retirements (Powell et al. 2001). Federal natural
resource management agencies employ more than 90,000 people and about one-half
of them are expected to retire by 2007. Reports from state agencies confirm
a similar pending labor need. Compounding the problem, national undergraduate
enrollment in natural resource science programs has declined since 1995 by
40% (Renewable Natural Resources Foundation 2003-4). A shortage of available
natural resource professionals is a problem for the DNR as it attempts to expand
the timber sale program. Washington logging companies report a similar shortage
of young people starting careers in timber harvesting and log truck driving
(Pickell pers. comm.)
3.7.6.
Increases in Federal Timber Unlikely
While significant increases in the federal harvest program appear to be unlikely
for the near term (Lamm 2005), as political pressures increase, it is logical
that some increases will occur. If increases are gradual and accompanied by
supply assurances that inspire confidence in infrastructure investments then
market disruptions may be minimized. If dramatic changes occur quickly, researchers
agree that unstable downward pressures on log prices would likely result. The
DNR sales program would appear to benefit in the absence of federal timber
offerings but could loose if more federal timber is released to the market.
3.7.7.
Green Energy
There are other policy changes at the national level that may influence the
DNR forest health and timber sales programs. When intense crown fires consume
overstocked forests, costs are high. Costs include the obvious such as fire-fighting
expense and destruction of property and resources. Costs also include the loss
of many values not readily measured in the marketplace such as damage to watersheds,
destruction of habitats, carbon releases to the atmosphere, and others (Mason
et al. 2003). There is a growing international concern over the risk posed
by global warming caused by fossil fuel combustion that releases carbon to
the atmosphere. Some policy makers argue that there is a connection between
reduction in atmospheric carbon and investments in small log removals to reduce
fuel loads and promote forest health. The federal government has responded
with the development of policies, price supports, technical assistance and
research programs, tax incentives, low interest loans, and other forms of public
economic support that are intended to reward investment in biomass-to-energy
projects. While many of these programs are national in scope and federally
funded, there are also others that may be offered by states, municipalities,
public utility districts, carbon credit traders, and non-governmental organizations
seeking to promote “green” energy programs. The success of price
supports from the Department of Agriculture for the conversion of agricultural
corn-to-ethanol provides ample example of how powerfully effective public investment
in green energy programs can be (Renewable Fuels Association 2004). However,
in spite of price supports, provision of stable woody biomass supplies from
federal lands remains a troublesome issue for potential investors. Biomass-to-energy
investments require a 10-20 year pay-back period. No new biomass-to-energy
facilities are under construction in Washington and feasibility studies, such
as the Yakima investigation mentioned earlier in this report, would seem to
indicate that the cumulative result of currently available price support mechanisms
is still insufficient to offset the high cost of biomass-to-energy projects.
Given the growing public interest in clean energy, adequacy of price support
could change, however, reliable biomass supply is likely more problematic.
Federal programs such as the National Fire Plan provide grant support for fuels
removals on all ownerships, especially in the wildland urban interface (WUI)
where risk to life and property is greatest, but so far have not resulted in
substantive increases in available biomass supplies. In most areas, only the
federal forests have volumes of biomass that if harvested could be sufficient
to warrant local investment in biomass-to-energy projects. However, continued
policy shifts toward increased public support for investment in forest health
and green energy programs have been and will continue to be beneficial to the
DNR harvest program.
3.8
Strong Public Interest in Forest Management
3.8.1.
Rural Economies
Rural communities, in Washington, are often economically depressed with higher
rates of unemployment than urban areas (Warren 2004). In many areas east of
the Cascade Mountains, it is the rural communities that are surrounded by overstocked
and unhealthy forests that are the most at risk from wildfire. While fighting
fires will induce some economic activity, much of that benefit goes to imported
labor with little positive local impact (Mosely and Shankle 2001). Fires also
hinder some rural economic activities such as tourism and recreation. Fire
risk reductions through fuels removal treatments, when scheduled over time,
produce positive and sustainable contributions to the economies of local communities
and provide increases to regional timber harvest. Since many of Washington’s
rural communities have lost jobs through the reduced sale of public timber,
the economic development aspect of thinning can be important. Warren (2004)
reports that, from 1991 to 2002, 22,000 forest products workers in Washington
and Oregon lost their jobs. Indirect job losses have been estimated to be 3 – 4
times that number (Conway 1994).
3.8.2.
Urban-to-Rural Disparity
Reductions in the harvests of public forests over the last two decades have
resulted in dramatic changes to the economies of Washington’s rural timber-dependent
communities. A national study entitled Development Report Card for the United
States (Clones and Rist, 1997) listed Washington as 48th in its assessment
of state urban to rural income disparity suggesting that the State’s
rural economy is declining compared to the urban economy. This report prompted
a University of Washington examination of State urban and rural per capita
income from 1979-1997 (CINTRAFOR, 1998). This study found an increasing urban
to rural income disparity in Washington State that by 1997 had reached 66%.
By comparison, from 1979-1997, the State’s urban center, King County,
had experienced a healthy increase in per capita income of 17% while the State’s
rural timber-dependent counties had experienced a decline in per capita income
of 29% (CINTRAFOR, 1998). In 2002, the Washington Employment Security Department
reported the widest urban to rural income disparity in 30 years (Mapes et al.
2002).
3.8.3.
Job Multipliers
Increases in the timber harvest activities on state forests can reasonably
be expected to result in economic benefits for rural communities. Warren (2004)
estimated direct forest industry employment in Washington and Oregon at 13.2
workers/MMBF of annual timber harvest for the year 2002. Han et al. (2002)
suggests that, depending upon the availability of paper industry jobs, the
number of direct jobs in Idaho may fluctuate from 9 to 11 forest products workers/MMBF
of harvest/year. Keegan et al. (2004) found that the harvest and processing
of saw timber generates 9 direct full-time jobs per MMBF per year in Montana.
In addition to direct forest industry employment, there are many more indirect
jobs that also result from timber harvest economic activities that provide
benefits throughout the state. Conway (1994) developed a regional interindustry
econometric model called the Washington Projection and Simulation Model (WPSM)
and estimated the total direct and indirect jobs per year created from one
million board foot of timber harvest in Washington State in 1992. Conway found
that for every direct industry job/MMBF/year another 4.2 indirect jobs were
created. He estimated that for 1992 there were 7.7 direct jobs and 32.3 indirect
jobs linked to each MMBF of timber harvest. The Conway multipliers are dated
and newer information is needed, the magnitude of direct/indirect job impacts
is important. While there have certainly been changes in efficiencies within
various job sectors that alter job multiplier relationships, some may decrease
while others may increase. For example, modern sawmill workers/unit product
may be less, but increases in secondary manufacture or government services/unit
product may be more. A greater share of the harvest made up by thinnings or
difficult to harvest areas and longer hauls also increase the labor content.
The practice of outsourcing more activities to local firms increases the jobs
multiplier offsetting some productivity gains. Changes in the DNR timber sales
and forest health program that result in a 150 MMBF increase in the available
annual log supply could mean an addition of 6000 direct and indirect jobs for
the region.
3.8.4.
Trust Revenue Benefits
Since DNR logs are purchased by both instate and out-of-state companies, not
all of the jobs linked to timber harvest will reliably stay within Washington.
This is not the case, however, for the trust revenue generated by the sale
of DNR timber. Revenue generated from DNR timber sales has a uniquely powerful
impact on state wealth; one hundred percent of stumpage revenues are reinvested
for the public good in government projects and services in Washington. Lippke
and Conway (1994) developed an estimate of the economic costs associated with
incremental decreases in trust revenue from reductions in the DNR timber sales
program. There are two ways to think about assessing such impacts. First, if
trust revenue that funds school construction and government operations is reduced
then, as activities slow, jobs in these sectors as well as those impacted indirectly
are lost. Second, if taxes for Washington residents are raised to replace trust
revenue shortfalls then job losses result from subsequent reductions in disposable
wealth. Lippke and Conway choose the second approach to simulate the jobs impacts
associated with an increase in state and local taxes and estimated that 29.7
Washington jobs would be lost for every $1 million in tax increases to replace
lost trust revenue. The DNR currently estimates the average stumpage value
of timber sold at $290/MBF (Aust 2004). If the DNR timber sale program increases
as anticipated by 150 MMBF/year; at $290/MBF the annual gross income would
be $43.5 million, which, using the Lippke/Conway conversion, would sustain
close to 1300 jobs/year that can reliably be expected to remain instate.
3.8.5.
Local, State, and Federal Tax Revenues
Further public benefits are derived from DNR timber sales through the generation
of local, state, and federal tax revenues. Local and state tax benefits are
calculated at 11% and federal taxes are calculated at 19% of the Gross State
Product (GSP) (Lippke et al. 1996). Using $50,000 as a low approximation of
the additional state economic activity added to the GSP from each new job,
an estimate of the GSP and associated local, state, and federal tax revenues
can be developed from the jobs to harvest ratios described above. Table 3.7
displays an estimate of the additional jobs, GSP, state and local tax revenues,
and federal tax revenues associated with alternative volume increases in DNR
timber sales of 100 MMBF or 150 MMBF per year. While it is unfortunate that
more current models are not available to better estimate the total employment
and economic benefits expected from state timber harvest increases, it is important
to note that some fundamental relationships are not likely to change dramatically.
For example, the state economic benefit as represented by the GSP from the
sale of state timber is more than eight times the gross stumpage value from
logs harvested from state forests and the combined local, state, and federal
tax revenue is more than twice the stumpage value because of all the down stream
processing and indirect economic activity supported.
While there are legitimate concerns about the public costs of harvesting sub-merchantable logs to reduce fire risk in overstocked eastern Washington forests, calculation of avoided forest fire costs added to employment and tax benefits mentioned above have been found to indicate that, even when government investments are required for fuel reduction programs, there can be a net public environmental benefit while creating economic development opportunities for rural communities (Mason et al. 2003). In 2004 (DNR) the Washington Forest Health Strategy Work Group issued a report to the State Legislature that arrived at similar conclusion and recognized that public investments in a state forest health program are prudent to avoid the many costs associated with fires, disease, and other forest health breakdowns.
| Table 3.7. Estimated Washington State Timber Jobs and Revenue Impacts. |
Trust Receipts
($Million)
|
Direct Jobs (Increase
Harvests)
|
Indirect Jobs
(Increase Harvests)
|
Indirect Jobs
(Trust Receipts)
|
Total Jobs
|
GSP ($Million)
|
State and Local
Tax ($Million)
|
Federal Tax ($Million)
|
Total Taxes ($Million)
|
|
| 100 MMBF | $29
|
770
|
3230
|
861
|
4861
|
$243.10
|
$26.70
|
$46.20
|
$72.90
|
| 150 MMBF | $43.50
|
1155
|
4845
|
1292
|
7292
|
$364.60
|
$40.10
|
$69.30
|
$109.40
|
3.8.6.
Public Support
Every year approximately 9 million people visit DNR-managed forests to enjoy
many recreation opportunities. Visitors include hikers, hunters, trail riders,
school children, and others. On trust lands, there are 143 recreational sites,
over 1100 miles of trails, and 13,000 miles of forest roads that are accessible
to the public. Other valuable public benefits provided by DNR managed forest
lands include scenic values, aesthetics, wildlife habitat, and ecological services
such as watershed protection, flood abatement, clean air enhancement, noise
abatement, and other non-market values. Forest health and timber harvest programs
are carefully designed to minimize conflicts with public multiple use expectations
(DNR 2004).
Today there are 45,000 jobs in Washington and 52,000 jobs in Oregon held by forest products workers with many times that number of jobs indirectly reliant upon forest management and products manufacture (Warren 2004). The DNR timber harvest program provides close to $200 million per year to trust beneficiaries such as public schools, universities, county governments, and others. Thousands of additional non-timber and government jobs result. The goal of the sustainable harvest calculation process for the DNR is to integrate the achievement of environmental values with a sustainable economic return to trust beneficiaries. Forest products workers, rural communities, recreationalists, and trust beneficiaries generally can be considered as public interests that benefit from and are supportive of the DNR forest management program.
3.8.7.
Public Opposition
There are also members of the public that do not support the current DNR harvest
program. Advocacy groups have organized well-financed public relations, legislative,
and litigation programs to disrupt the harvest of timber on DNR and other forestland
ownerships (Washington Environmental Council 2004). In 2004, the Washington
Environmental Council, the National Audubon Society, the Northwest Ecosystem
Alliance, and the Olympic Forest Coalition joined forces to file a law suit
in state court asking that the Board of Natural Resources decision to accept
the new DNR sustained yield harvest target be overturned. If this lawsuit is
successful a new calculation of sustainable harvest volume subject to imposed
constraints could be required by the court. If the courts were to rule in favor
of the plaintiffs and against the DNR, revenue and job projections would drop,
forest health activities would be delayed, and public costs would increase.
Similar litigation strategies have been very successfully employed to disrupt
federal harvest programs. Litigation is expensive and time consuming. Even
when law suits are not successful, litigation defense results in increased
costs, program delays, and lowered returns from harvest programs.
3.8.8.
Forest Certification
Another manifestation of strong public interest in forest management has been
the development of forest certification labels as a means to help consumers
identify and reward forestland managers and product manufacturers that follow
responsible and sustainable harvest practices. A number of different certification
programs have emerged. Generally, for all certification processes, forestland
managers wishing certified recognition of their stewardship practices must
undergo an initial review of current forest practices, modify current practices
as necessary to meet prescribed standards of acceptability, and submit to periodic
audits thereafter to ensure ongoing compliance to certification standards and
requirements. While each certification program may have its unique benefits
and draw backs, it is beyond the scope of this investigation to undertake critical
comparison of alternative certification programs. For reader convenience references
for more information about various available certification programs are provided
in the Appendix.
3.8.9.
DNR to Certify Forest Lands
For more than a decade the DNR has been encouraged to participate in third-party
certification of the forestry activities on state lands. In the fall of 2002,
the State of Washington developed a Sustainable Washington Advisory Panel,
convened by Governor Locke, with a purpose of achieving sustainability in the
state. In a subsequent report, dated February 2003, the Governor’s Sustainable
Washington Advisory Panel (GSWAP) recommended that the State should seek forest
certification as a way for the Department of Natural Resources (DNR) to manage
the state forests for today and tomorrow’s beneficiaries, as well to
achieve better economic, social and environmental performance. The Pinchot
Institute for Conservation, of Washington, D.C, provided $250,000 in funding
for a certification assessment of DNR west side forests. Funding was contributed
by private foundations, as well as Lanoga Corporation, the umbrella corporation
for Lumbermen’s Building Centers, a large home center store retailer
in the Pacific Northwest (DNR 2003, Stiffler 2003, Reiber 2003). In 2004, the
State Public Lands Commissioner announced that the DNR was moving forward to
obtain forest certification from at least one certification organization for
1.4 million acres of DNR forestlands west of the Cascade Mountains.
3.8.10
Certification Costs
As part of this investigation, estimates of the range of potential costs and
benefits to the DNR timber harvest program from certification have been examined
independent of label type. Forest certification requires third-party audit
of current forest practices as compared to prescribed environmental and other
standards. Once certification has been established a periodic review to ensure
ongoing compliance with certification standards is required. A number of studies
have examined the costs of these activities to forest land owners (Comnick
et al. 2004, Cubbage et al. 2003, Vogt et al. 2000, Mater et al. 1999, Hansen
1997). Actual costs of forest certification include an initial review process,
ongoing expenses of modifications to record keeping and planning procedures,
differed harvest revenues, and annual audits to assess future compliance. While
it is acknowledged in the literature that costs of ongoing increases in administrative
burden and revenue losses associated with differed harvests may be substantial,
comparable numbers for different forests are difficult to estimate. Subsequently,
costs of certification are generally reported based upon the expense per acre
of the initial review and the expense per acre of the annual audits. As would
be expected, the larger the forest; the smaller the cost per acre. From a review
of the literature, initial costs range from a low of $0.09/acre for the Minnesota
State Forest to a high of $27.20/acre for a non-industrial tree farm in New
England. Annual audit costs range from $0.01/acre for the Pennsylvania State
Forest to $7.85/acre for the small tree farm. The Pennsylvania State Forest
contains 2.1 million acres of forest land which is most similar in size, of
the lands reported in the literature, to the 1.4 million acres of state forests
in western Washington that may become certified. Pennsylvania forest lands
were certified in 1996 with funds provided by the Howard Heintz Foundation
at a cost of approximately $200,000. Annual licensing and auditing costs as
of 1998 were $11,446/year (Mater et al. 1999).
3.8.11.
Certification Benefits
Primary benefits of certification to forest landowners are thought to include
public recognition of environmentally responsible practices, access to premium
markets, and increased market share. In recent years some of the world’s
largest retailers such as Home Depot, Lowe’s, Lanoga Corporation, and
IKEA have made public commitments to pursue increased sales of certified forest
products. However, hard evidence of price premiums linked to certification
has yet to materialize. A number of studies have surveyed public attitudes
about certified forest products and have found that consumers are generally
favorable to certification and that some portions of respondents express willingness
to pay a premium for certified products (Irland 1993, Winterhalter and Cassens
1994, Forsyth et al. 1999). However, while consumers may express a preference
for certified products it has yet to be shown whether very many will pay a
price premium for certified wood products (Anderson and Hansen 2004, Rebhan
2004, Ozanne and Vlosky 2003, Fletcher et al. 2002, Vlosky and Ozanne 1998,
Hansen 1997). A review of the literature found little evidence to suggest that
premium prices are available for logs from certified forests. Very few log
buyers contacted in the course of this investigation felt that premiums for
certified logs from DNR forests would materialize (See response analysis to
survey questions 19-21 in section four of this report).
| Table 3.8. Certification Cost Comparisons. Two costs = two certification labels |
| Forest | Size in acres
|
Initial cost/acre
|
Annual cost/acre
|
Source
|
| Tree Farm, ME. | 100
|
$27.20
|
$7.85
|
Vogt et al. 2000
|
| Tree Farm, ME. | 1,000
|
$11.66
|
$1.82
|
Vogt et al. 2000
|
| UW Pack Forest Washington | 4,300
|
$8.68
|
$1.28
|
Comnick et al. 2004
|
| North Carolina State University | 4,500
|
$5.47 / $9.32
|
Not reported
|
Cubbage et al. 2003
|
| Duke University | 8,000
|
$2.92 / $4.18
|
Not reported
|
Cubbage et al. 2003
|
| North Carolina State Forest | 32,000
|
$0.54 / $0.72
|
Not reported
|
Cubbage et al. 2003
|
| Southern Industrial Forest | 100,000
|
$0.16
|
$0.06
|
Vogt et al. 2000
|
| Collins Pine | 100,000
|
$0.45
|
$0.05
|
Hansen 1997
|
| Aitkin County, Minnesota | 223,000
|
$0.12
|
$0.03
|
Mater et al. 1999
|
| Menominee Tribe, Wisconsin | 234,000
|
$0.21
|
$0.09
|
Rebhahn 2004
|
| Minnesota State Forest | 291,500
|
$0.09
|
$0.02
|
Mater et al. 1999
|
| Pennsylvania State Forest | 2,100,000
|
$0.10
|
$0.01
|
Mater et al. 1999
|
There may be other advantages to the DNR from certification, however. The public relations benefits may be significant. It is reasonable to assume that public confidence in DNR harvest policy, if strengthened by certification, could discourage lawsuits with resulting public savings. If expected savings on legal and administrative costs compare favorably with the full cost of certification then certification of state forests could be considered as prudent cost avoidance. Under such circumstances the apparent lack of any consumer premium might no longer be an issue.
The certification question at this time for State forests appears to be limited to the management of lands in western Washington. There has been no apparent discussion of certifying eastern Washington forests. As yet it is unknown what the implications of certification on west side DNR forestlands may be for implementation of forest health programs and the sale of logs from DNR managed forests on the east side.
4. Survey Results and Analysis
In order to better understand the capabilities and preferences of current and potential DNR timber sale purchasers, a survey was designed and distributed for response based upon recommendations from industry and DNR professionals. The purchaser survey was created to assess the characteristics, capacities, and preferences of potential purchasers of state timber. A total of 151 surveys were mailed to companies in four states. Of the total surveys sent, 2 were returned to sender for incorrect address (one company is out of business and the other has had personnel changes), 1 was returned from a California company not interested in Washington timber, and 67 (45% response rate) were returned that were used to complete the following purchaser analysis. Of the 67 responses, 50 were from regional milling companies with a combined operational capability of more than 100 forest products manufacturing facilities utilizing around 3 billion board feet of timber per year. 90% of respondent companies have been in business more than 10 years with 70% in business more than 20 years. Respondent companies appear to represent a combined workforce of 10-15,000 individuals with more than half of respondent companies reporting more than 100 employees. Two respondents were representatives of tribal forest enterprises. This section of the report will present the response data from this survey along with pertinent information from a previous DNR processor survey as well as industry reports from the literature towards providing an insightful accounting of the characteristics, capacities, and preferences of potential purchasers of state timber. Additional survey data and respondent comments are provided in the Appendix.
Table 4.1. Distribution of survey recipients and respondents by state and type.| Sent | Purchaser Type | Washington
|
Oregon
|
Idaho
|
California
|
Location Unknown
|
Total
|
| Processors | 47
|
36
|
6
|
7
|
96
|
||
| Non-Processors | 46
|
6
|
3
|
0
|
55
|
||
| Total | 93
|
42
|
9
|
7
|
151
|
||
| Returned | Processors | 27
|
9
|
4
|
2
|
8
|
50
|
| Non-Processors | 14
|
2
|
0
|
0
|
0
|
16
|
|
| Unknown | 0
|
0
|
0
|
0
|
1
|
1
|
|
| Returned/No Response | 2 Return to sender
|
0
|
0
|
1 Return no interest
|
0
|
0
|
|
| Total Valid Responses | 41
|
11
|
4
|
2
|
9
|
67
|
Table
4.2. Distribution of DNR processor respondents 2000-2002
by state (DNR 2003).
| Washington | Oregon | Idaho | California | Total | |
| Individual Companies | 44 | 27 | 7 | 5 | 83 |
| Total Responses | 70 | 62 | 8 | 5 | 145 |
A number of the companies contacted in the DNR processor survey had multiple manufacturing facilities with individual log purchasing agents. The total number of responses therefore represents the sum of all individual responses some of which may originate from the same parent company.
4.1 Purchaser Profiles
Question 1. How many years has your company been
in business?
Respondent companies report 90% with more than 10 years in business and 70
% with more than 20 years in business. Only one company reported being in business
less than 5 years. This distribution could indicate that respondents represent
a mature industry with little new entry.
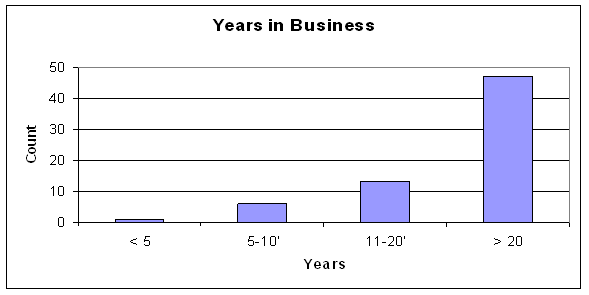 |
| Figure 4.1. How many years has your company been in business? |
Question 2. How many people does your company employ?
Respondent companies appear to represent a combined workforce of 10-15,000
direct employees with more than half of respondent companies reporting more
than 100 employees and 15% reporting more than 500 employees.
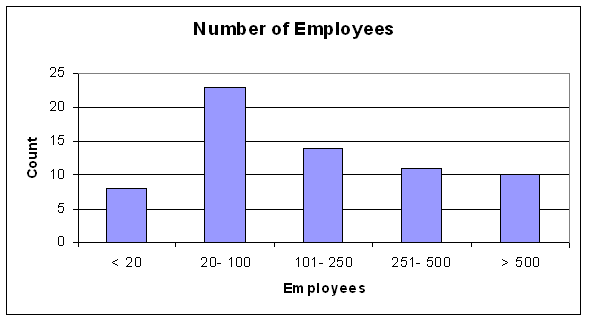 |
| Figure 4.2. How many people does your company employ? |
Question 3. What was your company’s average
annual log purchase volume (volume in million board feet
Scribner) during the last 5-year period?
When asked about average annual log purchase volumes, 52% of respondents indicated
purchases more than 25 MMBF of timber per year. 87% purchase more than 10 MMBF/year.
The combined purchasing power of all respondents is estimated to be around
3 billion board feet per year.
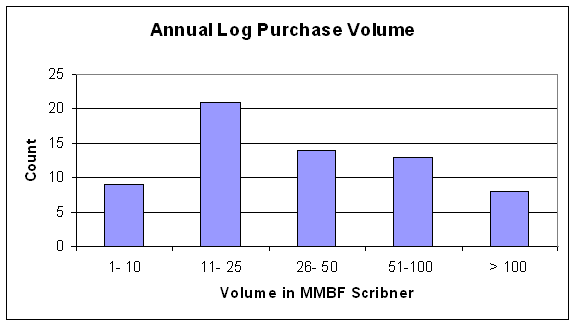 |
| Figure 4.3. What was your company’s average annual log purchase volume (volume in million board feet Scribner) during the last 5-year period? |
The processors survey distributed by the DNR asked a similar question. How much Scribner log volume per year is consumed by your facility(ies)? 65% responded that their company purchased more than 25 MMBF/year and 84% replied that they purchase more than 10 MMBF/year.
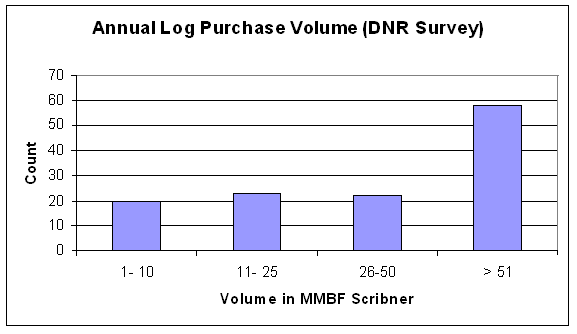 |
| Figure 4.4. How much Scribner log volume per year is consumed by your facility(ies)? (DNR 2003). |
Question 4. Where do you procure timber and/or logs?
Please enter % total in each box.
Displayed on the graph (Figure 4.5.) below in columns on the left is the percentage
of respondents that procure timber from each ownership source. Displayed on
the same figure in columns on the right is the average percentage of total
supply for each purchaser that is secured from each source. It is worthy of
note that the DNR appears to be the largest public timber supplier for purchaser
respondents.
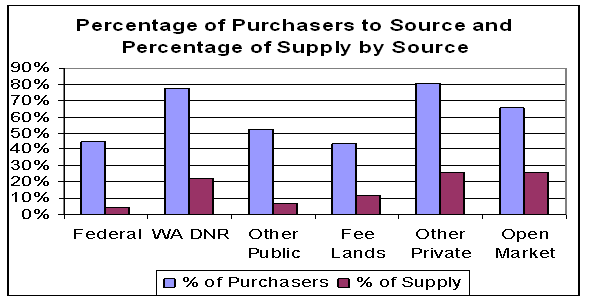 |
| Figure 4.5. Where do you procure timber and/or logs? |
The processors survey distributed by the DNR asked a similar question. Where have you purchased your logs in the last 10 years? The open market refers to logs delivered for sale to the purchaser’s yard. While open market logs, sometimes referred to as gate wood, appear to be the most commonly accessed source of logs for the mills responding to the DNR survey, 72% of respondents indicate that they purchase stumpage (standing timber) sales. Of those that purchase stumpage sales, 75% purchase from state agencies. It is important to note that this DNR data does not provide percentage of purchaser annual supply information.
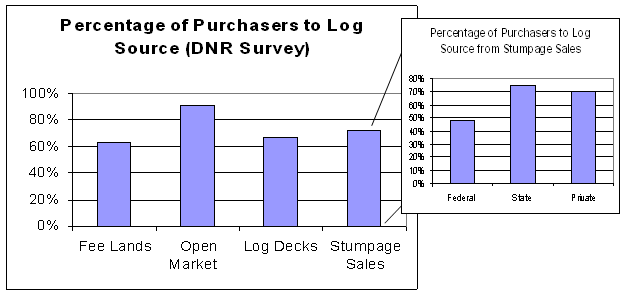 |
| Figure 4.6. Where have you purchased your logs in the last 10 years? (DNR 2003). |
The Western Wood Products Association (WWPA) compiles an annual Statistical Yearbook of the Western Lumber Industry. Data for log sourcing by mills by state from 2003 was reported in the 2004 edition of the yearbook. For comparison to the previous graphs, WWPA information will be reported here in Figure 4.7 by timber source for Washington, Oregon, and Idaho. The population of mills represented by WWPA membership includes some very large companies that don’t purchase state timber sales and subsequently were not selected to be represented in either the survey created for this report or the previously conducted processor survey supplied by the DNR.
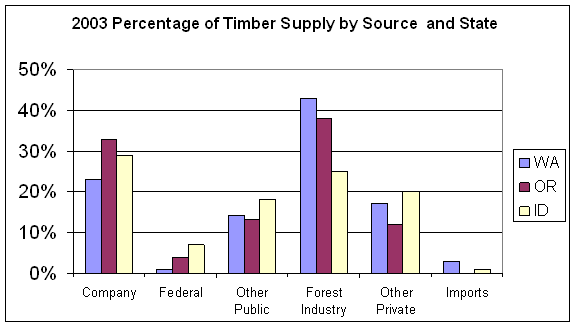 |
| Figure 4.7. 2003 Percentage of Timber Supply by Source and State (WWPA 2004). |
Question 5. What timber species does your company
prefer to purchase?
In Figure 4.8 the left hand columns indicate the percentage of respondents
that have preference for the species shown below. The columns to the right
indicate the percentage of annual timber purchase by species for respondents
that purchase that species.
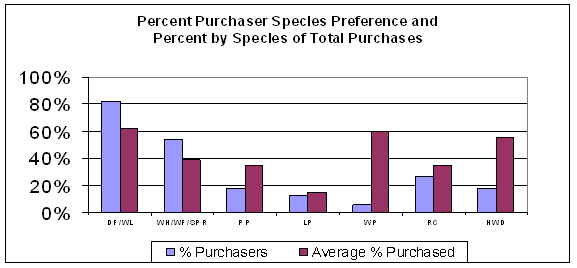 |
| Figure 4.8. What timber species does your company prefer to purchase? |
The species preference responses (left hand columns) reveal that Douglas-fir
and western larch (DF/WL) are the most popular timber choice with more than
80% of respondents indicating purchases of these species. White woods (WH/WF/SPR)
are second with more than half of respondents indicating purchases of these
species. In this case white woods refer to western hemlock, white fir, and
Sitka spruce which are often interchangeable in the market place. Douglas-fir,
larch, and white woods are species that are broadly used and purchased from
forests both east and west of the Cascade Mountains. Of particular concern
potentially for the DNR forest health program could be the apparent lack
of interest amongst respondents for the eastern Washington pine species:
Ponderosa pine, lodgepole pine, and western white pine (PP, LP, WP). Western
red cedar (RC) and hardwoods (HWD) are purchased respectively by 27% and
18% of respondents.
Only 17 respondents or 25 % (9 – DF/WL, 2 – WH/WF/SPR, 1 – WP,
3 – RC, 2 – HWD) indicated that their timber purchases were restricted
100% to a single species or species group. The columns to the right in Figure
4.8 indicate more about how species preferences may influence purchasing behavior.
Amongst DF/WL purchasers, the average percentage purchased annually was 62%.
No other species group comprised more than half of average annual purchases
indicating that many purchasers appear to be opportunistic about what mix of
species that they might choose to purchase. In the context of previously presented
information, an infrastructure pattern emerges of an industry dominated by
older large production companies that must purchase multiple species to satisfy
raw material needs. If this is the case, then companies may be persuaded to
increase purchases of east side species as new timber volumes become available
through forest health programs.
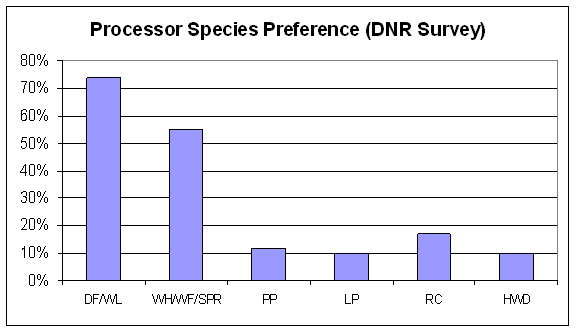 |
| Figure 4.9. Processor Species Preferences (DNR 2003). |
The DNR processor survey produced additional response information on purchaser species preference that shows a similar distribution (see Figure 4.9).
The Western Wood Products Association reports annual species use based upon sawmill lumber shipments. Figure 4.10 displays 2003 WWPA species data for Washington, Oregon, and Idaho. Note that in contrast to stated purchaser preferences shown above, Washington lumber production of hem-fir was greater in 2003 than its production of Douglas-fir. The same story as seen above is apparent for all three states, however, in regards to production capacity for pine species. If large increases in pine harvest activities are to result from forest health activities then additions to milling infrastructure may be needed.
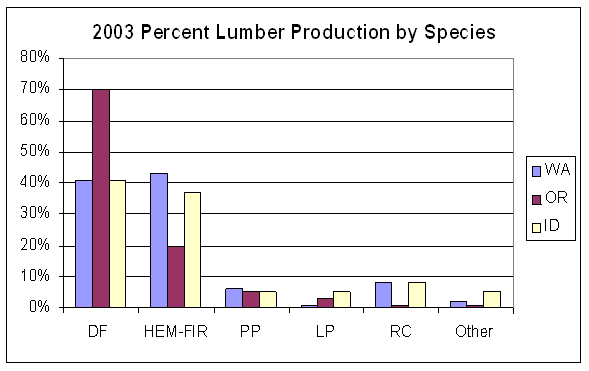 |
| Figure 4. 10. 2003 Percent of lumber production by species for Washington, Oregon, and Idaho (WWPA 2004). |
Question 6. What log diameter ranges does your company
normally prefer to purchase (check one or more)?
In apparent contradiction to information mentioned earlier in this report that
was taken from recent studies and industry journals, more than 40% of respondents
report purchasing logs greater than 24 inches diameter. 12% of respondents
indicated that they take logs less than 5 inches in diameter. Logs 8 – 24
inches in diameter are widely acceptable.
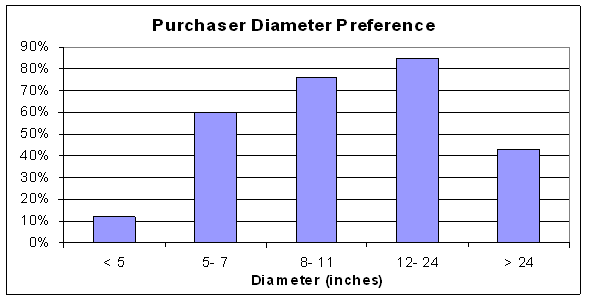 |
| Figure 4.11. What log diameter does your company normally prefer to purchase? |
The DNR processor survey asked for diameter preference information also but did not ask specifically about very small and large logs. Processor responses appear in agreement with the Figure 4.11 above. Both sets of responses show more than 60% of respondents purchasing logs 5 – 7 inches in diameter. Response data tells a somewhat different story about small and large log capacities than might be indicated by the literature. One factor that could be considered that might explain this contrast is price difference. Survey responses don’t contain information about purchaser price expectations for timber size classes.
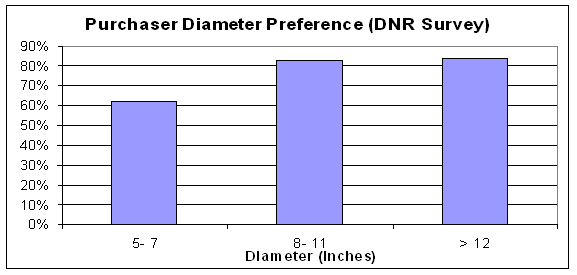 |
| Figure 4.12. What diameter range of logs do you purchase? (DNR 2003). |
Question 7. What log qualities does your company
purchase (check one or more)?
Purchaser responses show that most companies prefer to purchase saw logs rather
than pulp logs with the greatest preference shown for high grade saw logs.
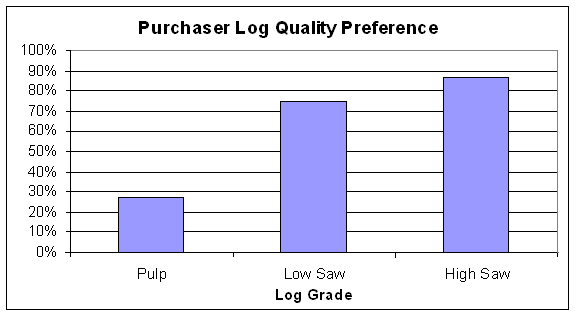 |
| Figure 4.13. What log qualities does your company purchase? |
67% of DNR surveyed processors prefer to purchase mixed qualities of log grades with 13% purchasing all grades (pulp thru high grade saw logs), 18% purchase one saw log grade plus pulp, and 15% purchase low and high grade saw logs only. Only 1 respondent purchases pulp exclusively while 10% took low grade and 19% took high grade saw logs exclusively.
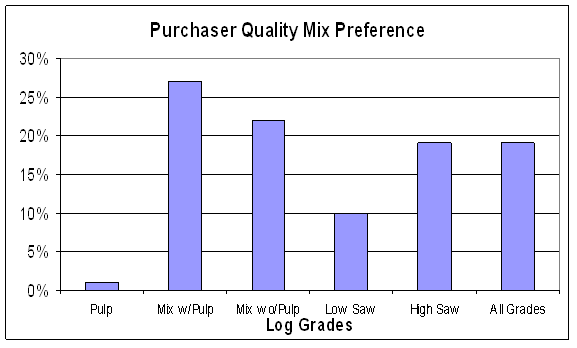 |
| Figure 4.14. What log quality mixes do purchasers prefer? |
The DNR processor survey asked if respondents used low grade saw logs and/or high grade saw logs in their milling facilities. Responses showed that 69% used some low grade and 70% used some high grade. When asked about ring count, responses indicated 63% used low ring count and 61% used high ring count.
Summary of respondent background information.
- Respondents are primarily well-established older companies that have survived the decade of the 1990’s which saw the closure of many other forest products companies.
- Respondents are well distributed by size as indicated by the range of variability in the number of employees and the annual timber volumes purchased.
- Respondents appear to be versatile when sourcing timber. While almost 80% of purchasers procure timber from the DNR, DNR timber accounts for a little more than 20% of average annual supply. Even though federal timber accounts for only 4% of average annual respondent supply, 45% of respondents report purchasing some volume of federal timber. Private timber from a variety of sources would appear to dominate regional supply.
- While respondents display versatility in species use, there is relatively little interest in pine species. This may indicate an infrastructure problem that could be of concern in planning a large scale forest health program for eastern Washington. Douglas-fir and white fir, both understory shade tolerant species removed in forest health treatments, would appear, however, to be species with strong demand.
- The distribution represented by respondent diameter preferences appears to be broader than a review of the current literature might suggest with buyers available for very small and large diameter logs. However, a closer look at respondent data shows that amongst those indicating that they purchase logs less than 5 inches in diameter only two respondents are from the east side and only one appears to be a small diameter specialist. The remainder of respondents that report purchasing smaller wood also purchase most other diameter classes as well. This might be a relic of what is referred to as the camp run approach to timber purchases where all sizes and species are purchased with some or all volume resold to specialist purchasers. For large logs, 40% of respondents report purchasing logs 24 inches in diameter and larger. A closer look shows that among those that indicate purchases of large logs only four can be identified as large log specialists. One is in Oregon and three are in Washington.
- While purchasers display a willingness to use timber of multiple grades, only one respondent appears to be a pulp specialist. The distribution of grade preferences would indicate, as suggested previously, that many purchasers appear to employ a camp run approach to timber purchases. The relatively small percentage of timber buyers with interest in pulp logs may be indicative of currently insufficient infrastructure to utilize large volumes of sub-merchantable materials from forest health treatments.
4.2 Timber Sale Preferences
Question 8. What size (volume in million board feet Scribner) timber sale would your company prefer to purchase (check one or more and circle preferred size)?
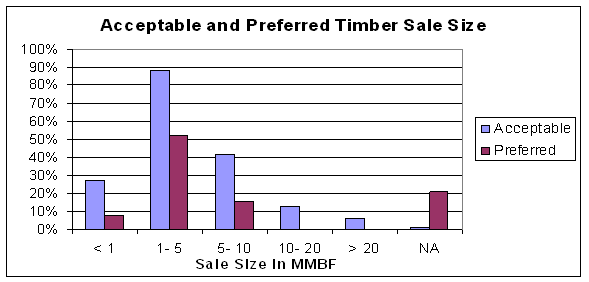 |
| Figure 4.15. What size timber sale would your company prefer to purchase? |
Some respondents appear willing to purchase timber sales
of all sizes (columns on the left) from very small (less
than 1 MMBF) to very large (greater than 20 MMB). Almost
90% express willingness to purchase sales that are 1-5 MMBF
in size. Respondents circled the most preferred timber sale
size. This data is displayed in columns on the right. None
of the respondents indicated that timber sales of 10-20 MMBF
or greater than 20 MMBF were preferable. 52% favored sales
1-5 MMBF and 21% (NA) didn’t select a preference indicating
that they would buy sales both large and small. Only 8% indicated
preference for sales of less than 1 MMBF.
Question 9. What would be your company’s preferred
contract life for a timber sale?
A majority (51%) of timber purchasers responded that their preferred timber
sale contract life is 3 years. 22% said 2 years and 9% said 5 years. Very few
wanted 1 year contracts (which may be considered as the survey surrogate for
spot market or cash sales). It is interesting that respondents were so certain
of their preferences that only 6% indicated that the determination of timber
sale contract life should be dependent upon market conditions.
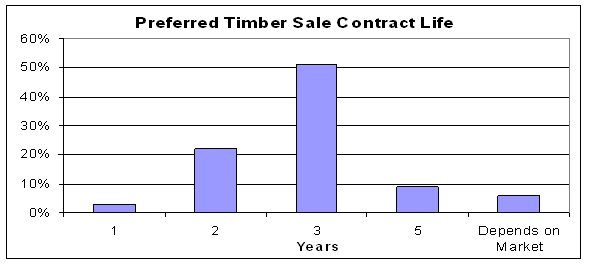 |
| Figure 4.16. What is the preferred contract length? |
Question 10. What type of timber sale do you prefer?
Displayed below in Figure 4.17 is the response information from the project
survey (columns on the left) and the previous DNR processor survey (columns
on the right) for the question, what type of timber sale do you prefer. The
popular response to this question is pretty clear. Scale sales are the overwhelming
favorite from both surveys (72%, 69%) with lump sum sales receiving less
votes at 36% and 42%. There is very little interest in other timber sale
types from the project survey respondents but greater interest is shown from
DNR survey respondents. It may be that since the DNR surveyed only manufacturers
that the increased interest shown in contract/direct and log deck sales is
indicative of a preference difference between processor and non-processor
purchasers.
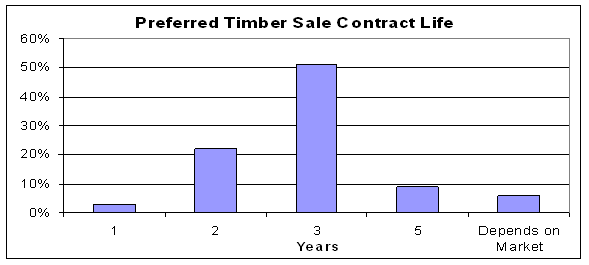 |
| Figure 4.17. What type of timber sale do you prefer? |
Question 11. What measure of log volume is best
used to describe timber sales?
Fifty years ago, there were foresters that called for the conversion from log
scale to cubic scale (Rapraeger 1950, Orchard 1953). Momentum gathered in the
1970’s led by the Forest Service to convert to cubic measure. Studies
show that as logs get smaller and the difference between actual and nominal
size in lumber widens the inaccuracies of measuring logs in board foot Scribner
increase (Larsen 2002, Spelter 2002). However, when asked which measure of
log volume should be used for timber sales, survey respondents were clear.
96% reported that board feet Scribner should be how timber is measured for
sale. 18% agreed that tons could also be used to measure log volumes especially
where logs were small diameter. No respondents indicated that either cubic
feet or cubic meters should be used.
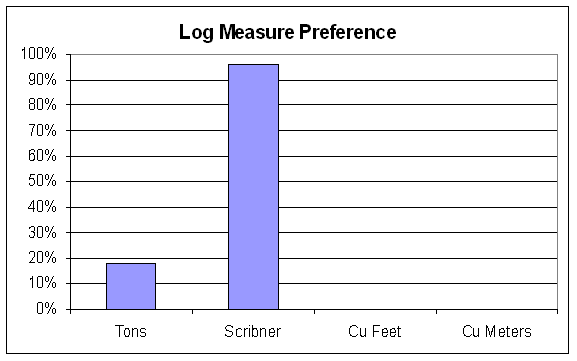 |
| Figure 4.18. What measure of log volume is best used to describe timber sales? |
The DNR processor survey asked respondents what aspects of the DNR timber sales
program could be changed for improvement. 23% responded that contract length
of timber sales could be improved, 12% responded that sale design could be
improved, and 11% responded that adjustments to sale size were needed. Project
survey respondents were clear about preferences in regards to these concerns.
- Sale Size. Most timber sales should be 1-5 MMBF with an occasional sale that is smaller and an occasional sale that is bigger. No sales should be bigger than 10 MMBF except under extreme circumstances such as salvage and forest health emergencies. The responses show that if some big sales are offered there are some companies that will buy. However, since the bigger sale size is not a respondent preference it is likely that timber values may be discounted as sales get larger than 10 MMBF.
- Contract Life. Two thirds of sales should have contract lengths of 3 years. One third of sales should have contract lengths of 2 years. Occasional sales with short contract length should be saved for salvage and forest health emergencies.
- Sale Type. Approximately two thirds of sales should be scale sales with one third of sales as lump sum. Limit as possible contract/direct and log yard deck sales to not more than 10% of total annual sales, however, the minority of purchasers that prefer these sale types may pay niche market premiums.
- Timber Measure. All sales with significant saw log volumes should be measured in board feet Scribner. Forest health, salvage, and thinning sales may be sold by the ton.
Question 12. How many sawmills or other manufacturing
facilities does your company own?
Displayed below in Figure 4.19 is the response information from the project
survey (columns on the left) and the previous DNR processor survey (columns
on the right) to the query about how many mills the respondent company owns.
Since the DNR survey was sent exclusively to processors, only respondent information
taken from the project survey provides data for companies with no mills. 24%
of respondents to the project survey indicated not owning milling facilities.
Total mills represented by respondents to the project survey were at least
107. Total milling facilities represented by the DNR processor survey respondents
appear to be 178.
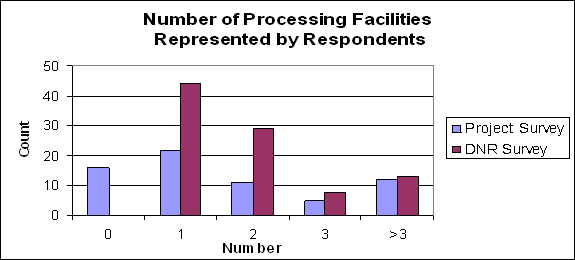 |
| Figure 4.19. How many manufacturing facilities does your company own? |
The project survey also asked respondents if their company milling facilities were running at capacity. Nearly 50% replied that their mills were running at full capacity. The DNR processor survey queried respondents as to which products that their mills produced (Figure 4.21). The results indicate that, in contrast to reports from the literature that the suite of industry products has narrowed, a diverse product mix including specialties and clears is still being produced by the subset of the existing milling infrastructure that is represented by survey respondents.
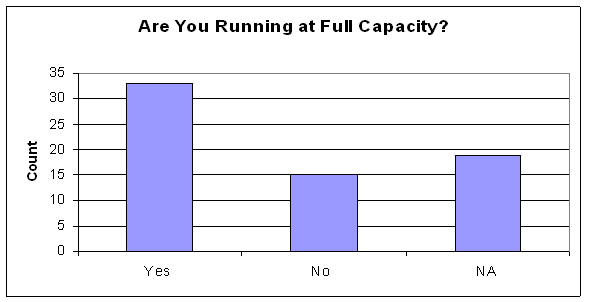 |
| Figure 4.20. If your company operates milling facilities, are you running at capacity? |
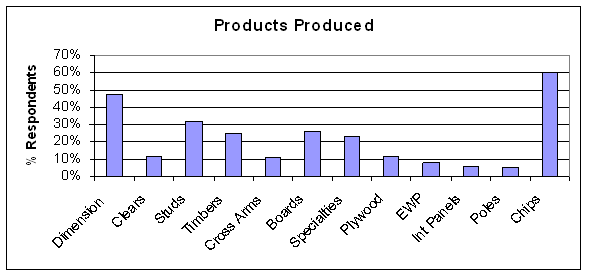 |
| Figure 4.21. What products are produced at your company processing facilities? (DNR 2003) |
Question 13 & 14. How are harvest operations conducted by your company? How are trucking operations conducted by your company?
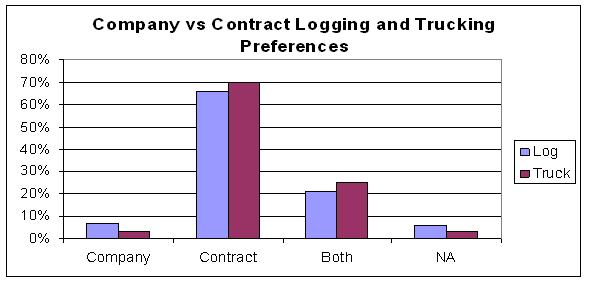 |
| Figure 4.22a. How are logging and trucking operations conducted by your company? |
In response to these questions DNR purchasers clearly indicate
reliance upon contract relationships to handle most of the
operational arrangements for harvest and haul of DNR purchased
timber sales.
Question 15. Has your company ever used rail or barge
services to transport logs long distances?
In response to this question, 59% of respondents indicated that they had used
rail or barge services to ship logs long distances.
Question 16. How many miles will your company ship logs
from the timber sale to the mill?
This question was asked of respondents in both the project survey and the DNR
survey. Results would appear to indicate that many purchasers are willing to
ship logs great distances to their mills or customers.
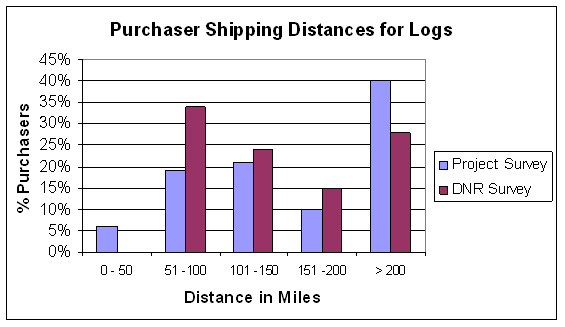 |
| Figure 4.22b. How many miles will your company ship logs from the timber sale to the mill? |
A closer look at the project survey data reveals that willingness to ship great distances is not necessarily dependent upon whether the purchaser has manufacturing facilities. 40% of non-processor (No Mills) respondents indicated willingness to ship logs more than 200 miles to market. 46% of companies with milling facilities (Mills) will ship logs further than 200 miles.
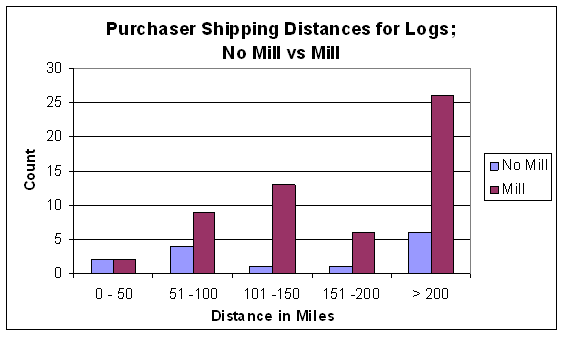 |
| Figure 4.23. How many miles will your company ship logs from the timber sale to mill/customer; a comparison of companies with and without milling facilities? |
A review of log size and grade preferences relative to purchaser
willingness to ship greater distances showed no correlation
between size, grade, and shipping distance preference. This
finding is in contrast to the conclusion in the Big Log Project
(Wagner et al. 2003) that larger higher quality logs are
transported further distances than smaller low quality logs.
Question 17. How would you describe current log availability?
Half of the project survey respondents indicated that they are running at capacity
suggesting sufficient log supplies have been secured for their operations (see
Question 12). When asked to describe current log availability most respondents
felt that logs are sometimes scarce. However few respondents report extreme
market conditions, only 2 respondents reported that logs are always scarce
while none reported regular oversupplies.
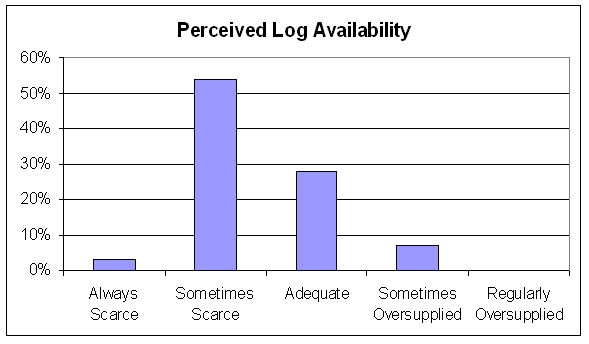 |
| Figure 4.24. How would you describe log availability? |
Question 18. Do you feel that volumes of U. S. Forest
Service and BLM timber available for harvest are likely
to increase appreciably in the future?
The previous question (Figure 4.24) would appear to imply that a healthy market
is currently available for log sales; that is a market where sufficient scarcity
exists to support healthy competition amongst log purchasers but supply short-falls
are not so extreme as to result in decline of the infrastructure. A decade
ago this would not have been the case as reflected by supply-shortage-driven
price spikes and mill closures. A notable change for log markets between 1994
and 2004 is that the current purchasing infrastructure has transitioned to
where it is no longer dependent upon log supplies from federal lands. Figure
4.5 shows that project survey respondents report that federal logs account
for only 4% of current supply needs. Figure 4.7, which displays WWPA log supply
data from 2003, shows that federal harvest volumes accounted for 1%, 4%, and
7% of log supplies to region mills for Washington, Oregon, and Idaho respectively.
However, if a growing public interest in forest health and restoration, as
reported earlier in this report, would translate into project implementations
on federal lands, increases to the federal harvest should logically be one
result. While federal logs currently constitute an insignificant portion of
regional supply, 45% of project survey respondents report that they purchase
some logs from federal forests (see Figure 4.5). It seems likely, therefore,
that if more federal logs would become available many DNR log purchasers are
positioned to respond quickly to this supply. However, when asked if purchasers
anticipate increases in federal log supplies, not very many respondents were
optimistic. When survey respondents were asked if they thought that volumes
of timber would likely increase from federal lands, 63% indicated this was
unlikely or impossible and 21% responded that they were uncertain.
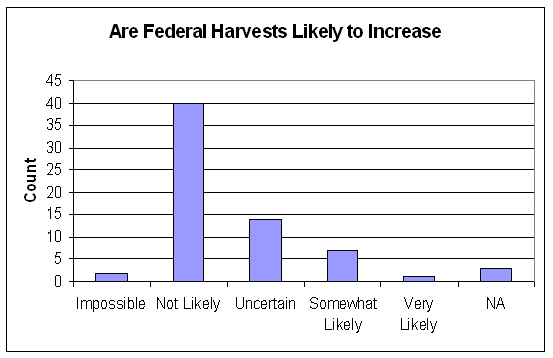 |
| Figure 4.25. Do you feel that volumes of U.S. Forest Service and BLM timber available for harvest are likely to increase appreciably in the future? |
Substantial international resources have been expended to develop forest certification programs designed to promote sustainable and environmentally benign forest management practices. Generally it is assumed that benefits return to forest owners that invest in certification for their companies. Speculation about benefits derived from extra management costs borne by certified forest owners, as discussed earlier in this report (see section 3. 8. 11.), has included price premiums and increased market share (customer preference for certified products). The next few project survey questions were designed to provide information on log purchaser perceptions in regards the benefits of forest certification and purchaser willingness-to-pay for certified logs.
Question 19. Are you familiar with forest certification programs such as those offered by the Forest Stewardship Council and the Sustainable Forestry Initiative?
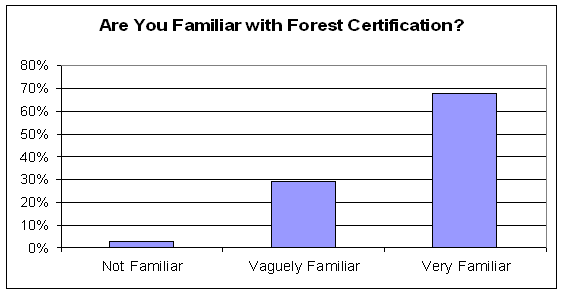 |
| Figure 4.26. Are you familiar with forest certification programs such as those offered by the Forest Stewardship Council and the Sustainable Forestry Initiative? |
Question 20. The state of Washington is considering
the certification of state forestlands. How does your company
regard forest certification?
While a majority of respondents reported that they
felt that certification was either not very important or
a waste of money, 32% reported that they felt that certification
is somewhat or very important.
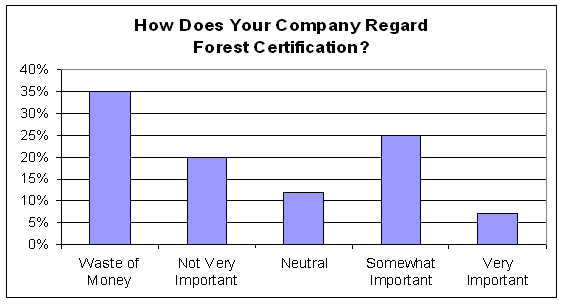 |
| Figure 4. 27. The state of Washington is considering the certification of state forestlands. How does your company regard forest certification? |
Question 21. If the state forestlands were to become
certified would state logs become more valuable to your
company than logs from uncertified forests?
Most of the survey respondents showed no interest in paying premiums for certified
state logs (85% No and 6% NA) indicating that currently there is little market
for certified logs within the market region. However, 9% of respondents did
express willingness to pay a premium for certified state logs indicating that
a niche market for such products may exist.
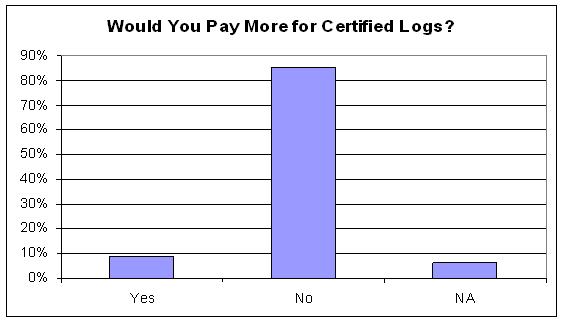 |
| Figure 4. 28. Would you pay more for certified state logs? |
Question 22. Many areas of the inland west are plagued by high risk of forest fire as a result of overly dense forests, drought, and insect infestations. Public and Private forestland managers have been expanding the use of forest thinning to remove fuel loads in these fire-prone forests. How does your company regard the use of thinning to reduce fire risk on these east-side dry forests?
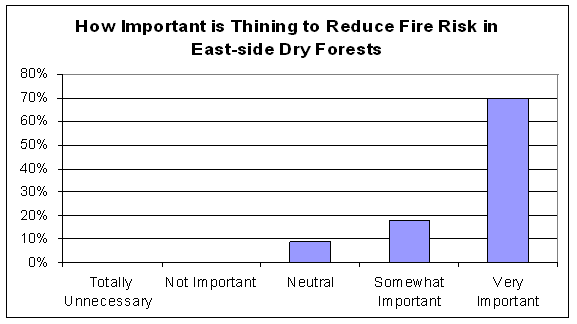 |
| Figure 4. 29. How important is thinning to reduce fire risk in east-side forests? |
88% of survey respondents indicated that removal of excess
fuel loads through the use of forest thinnings was somewhat
to very important with 70% agreeing that this is a very important
activity. There were no respondents that indicated that thinning
to reduce fire risk was either not important or totally unnecessary.
Question 23. For the next few years the WADNR has made
reduction of fire risk through thinning a management priority
on state-owned east-side forests. This could mean an increase
in availability of small diameter timber. Would your company
be interested in expanding its use of logs from 3 to 6 inches
in diameter if long-term supplies could be made available?
22 survey respondents (33%) indicated that their companies would be interested
in expanding use of small diameter timber (SDT) if supplies could be made available.
The response distribution to this question is in contrast to the response information
from Question 6, “What log diameter ranges does your company normally
prefer to purchase?” Only 12% (8 respondents) of purchasers indicated
preference for logs less than 5 inches in diameter.
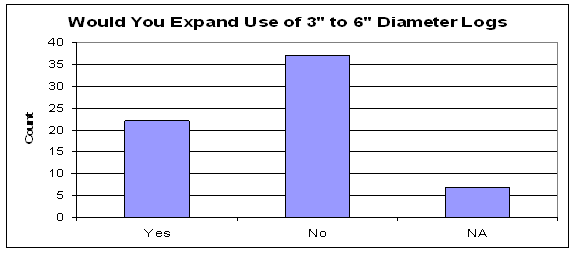 |
| Figure 4.30. Would you expand use of 3” to 6” east-side DNR logs? |
Of particular interest may be the distribution of purchasers that indicated interest in expanding their operations to utilize 3” to 6” diameter logs. Figure 4. 31. (Companies with interest in small diameter timber) shows that potential purchasers of small diameter timber are located both east and west of the Cascades in WA, OR, and ID and include mill and non-mill owning companies. Three purchasing companies that expressed interest in SDT did not report the location of their operations, however, two of the companies reported owning sawmills with one company claiming more than 3 and the other claiming 1. The third unknown respondent did not indicate if the company owned a mill. Summing the approximate total purchasing power of companies responding favorably to potential SDT utilization opportunities indicates an annual total purchasing capability of more than 735 million board feet and at least 32 milling facilities.
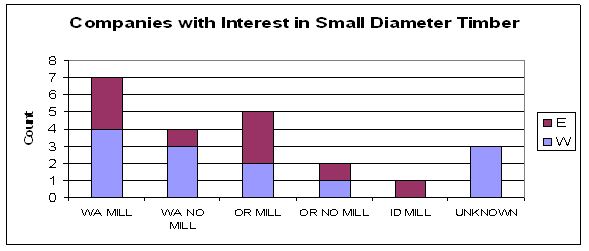 |
| Figure 4.31. Companies with interest in small diameter timber. |
Question 24. What would you think could be the most
likely use for these small diameter logs?
The majority of respondents (72%) indicated that they expected small diameter
logs to be used primarily for chip production as historically has been the
case. After chips, the next likely use for SDT expected by respondents was
biomass for cogeneration (31%). Respondents were encouraged to select multiple
uses as logs are rarely dedicated to a single product line. Engineered wood
products, fiberboard, and “other” all received 16% of responses
with most respondents that selected “other” indicating that they
expected SDT to be manufactured into lumber and chips. 8% thought that SDT
could be made into fencing and 12% of survey respondents chose not to answer
this question.
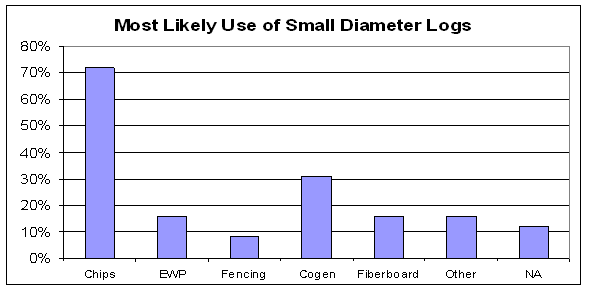 |
| Figure 4. 32. What is the most likely use of small diameter logs? |
Question 25. Has your company considered expanding
capacity within the next five years?
43% of companies responded that they had considered expanding the capacity
of their operations within the next five years. Of the 57% that responded that
they hadn’t considered expanding the capacity of their operations, many
cited concerns about reliable timber supply as the reason.
 |
| Figure 4.33. Has your company considered expanding capacity within the next five years? |
Of the companies that did consider expansion, most are milling companies. Geographically these companies are broadly distributed with the majority in eastern and western WA and OR and a few additional companies located in ID and CA. Figure 4. 34. is provided to show this distribution.
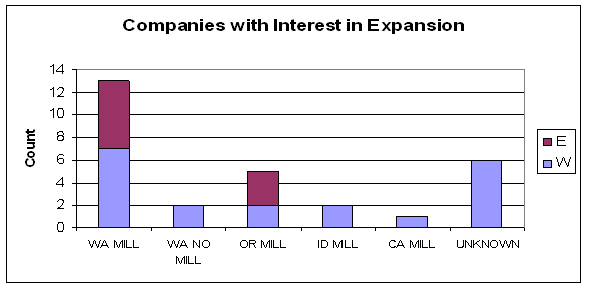 |
| Figure 4.34. Companies with interest in expansion. |
When company interest in capacity expansion is compared to company interest in expanding utilization of 3 to 6 inch diameter SDT (question 23), it is apparent that a majority of companies willing to expand use of SDT have also considered expanding operational capacity. This information may indicate that there is a willingness amongst a subset of timber purchasers to make investments in new infrastructure for small diameter utilization. Amongst purchasers east of the Cascades, three purchasers in WA, 4 purchasers in OR, and 1 purchaser in ID indicated both a willingness to expand operations and to increase utilization of SDT. In the comments that accompanied question responses (see Appendix), the single dominant concern in regards company expansion consideration was reliable log supply.
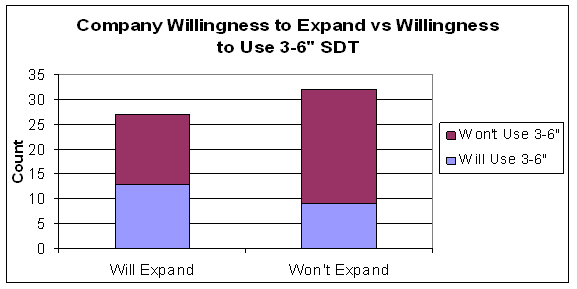 |
| Figure 4.35. Company willingness to expand vs willingness to use SDT. |
Question 26. Timber sales that are designed to achieve
improved forest health conditions may require management
activities in addition to harvest such as the piling and
burning of underbrush or the removal of surplus road surfaces.
How should such activities be considered within the timber
sale program?
Half of the respondents indicated that forest health activities that might
be in addition to timber harvests could be designated as the responsibility
of either the DNR or the timber purchaser given the understanding that the
bid price would adjust accordingly. 41% wanted no part of such additional responsibilities
and indicated that the DNR should handle these activities apart from the timber
sale program. Very few respondents wanted these activities to be solely the
purchaser responsibility.
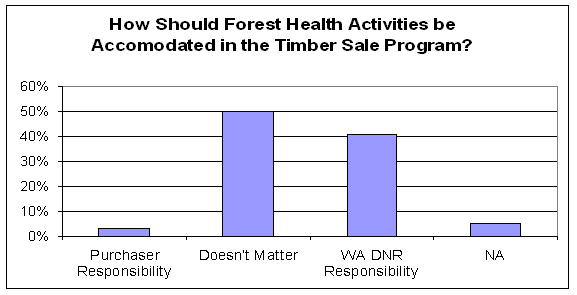 |
| Figure 4.36. How should forest health activities be accommodated in the timber sale program? |
Question 27. In which regions has your company purchased
state timber sales?
10 survey respondents (15%) indicated that they hadn’t purchased DNR
timber while 57 indicated that they had purchased timber from the DNR. Many
purchasers are active in multiple regions with competition in all areas.
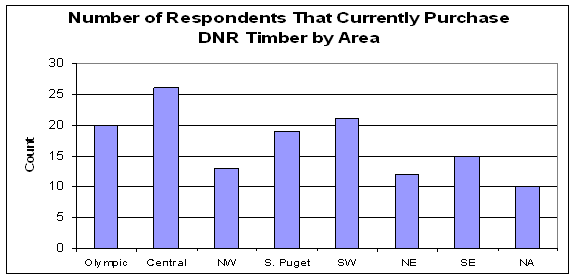 |
| Figure 4.37. Number of respondents that currently purchase DNR timber by purchasing region. |
Question 28. Do you have interest in purchasing
WADNR timber from east of the Cascade Mountains?
64% of respondents (43) indicated interest in purchasing east-side timber from
the DNR. Of the 43 respondents with interest in purchasing east-side DNR timber,
22 indicated that they have considered expansion, 18 said that they would use
SDT, and 13 said that they would expand and use SDT.
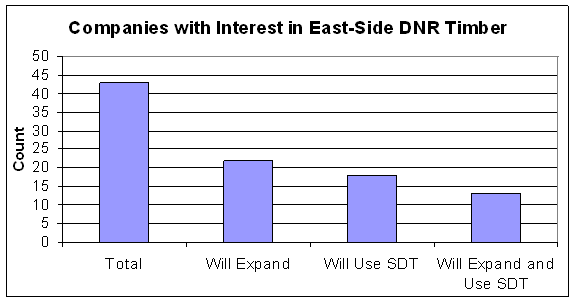 |
| Figure 4.38. Companies with interest in east-side timber. |
39% of respondents (26) indicated that they would like a WADNR representative to contact them about changes in the timber sale program and increases in available timber volumes from eastern Washington.
Some respondents offered comments in addition to survey responses. These comments are provided in the Appendix along with a copy of the original survey form and the response data.
5. Discussion
Forest health harvesting activities to remove excess fuel loads from overstocked stands within DNR forests in eastern Washington are expected to produce merchantable timber volumes of 25-35 million board feet Scribner (MMBF) per year for the next 5-7 years. As yet undetermined volumes of trees too small for most DNR timber purchasers will also be removed to reduce current fuel loads. Other recent adjustments to the DNR timber sale program such as the recalculation of the annual sustainable harvest level and amendments to the State Habitat Conservation Plan are expected to result in additional increases of 100 to 150 MMBF in annual timber sales volumes as compared to recent years. These increases to available regional timber supplies come at a time when the number of sawmills in Washington is at a record low following rapid adjustments to industry infrastructure in response to reductions in public timber availability, changes in sawmill technologies, global market fluctuations, and other factors.
There is a large body of information from the literature to indicate that increases in some harvest activities are warranted in both west side and east side forests. Ecological benefits from targeted forest management activities appear to include reduced risk of forest mortality from fires, drought, disease, insects, and other disturbances as well as protection of public resources such as air and water, improvements in habitat qualities for sensitive species, and acceleration of the development of old forest conditions. Economic benefits can include increased stumpage returns for trust beneficiaries, improvements in tax revenues for local, state, and federal taxing authorities, avoidance of wildfire liabilities, and economic development opportunities for resource dependent communities.
This project has been designed to assess multiple influences that affect the market receptiveness to increased timber volumes and changing log types that are anticipated from adjustments to the DNR timber sale program. Since logs and forest products travel great distances across state and national boundaries, an investigation of local markets must include examination of broad influences. Factors considered that influence marketability include the existing timber industry infrastructure, infrastructure adaptability to change, regional supply and demand, and market strategies that best serve timber purchaser preference. Information provided in this report has been assembled to help maximize attractiveness of DNR timber sales program, insure favorable revenue benefits to trust beneficiaries, assist in substantive and effective improvements to the health of state forests, and inform potential for economic development.
Projected increases in DNR timber harvest levels, while significant, represent a relatively small addition to total available Washington and Oregon timber supply (less than 2%). Given that a majority of timber purchasers report log scarcities, that increasingly distant purchasers are competing for DNR logs, that DNR stumpage prices have risen 30% over the last year (Aust 2004), and that new sawmill start-ups and expansions are expected to add 1 billion board foot of production capacity in Washington within the next few years (Stevens 2005), this relatively small addition to available regional timber volume is unlikely to cause negative market reaction. By contrast, many of the factors presented for consideration in this report would appear to indicate that state harvest volume increases come at a time when the DNR may be uniquely positioned for market advantage.
The DNR typically manages its forests for longer rotations with less intensive efforts to maximize growth than industrial forest landowners and subsequently produces finer grained saw logs that are especially attractive to purchasers. The increased use of rail and water freight to transport logs further from the woods to the mill has served to broaden the DNR timber purchaser pool. 40% of survey respondents report shipping logs greater than 200 miles. Interestingly, a review of log size and grade preferences relative to purchaser willingness to ship long distances showed no correlation between size, grade, and shipping distance. These factors combined with imbalances in the age-class distribution of private forest ownerships may mean unique market opportunities for the DNR timber sales program if specific log types can be offered to receptive customers at times of greatest supply need.
The DNR marketing and sales department has new programs to capitalize on such opportunities by focusing timber sales offerings to best suit a range of customer needs. A data base has been created to track purchaser interests and inform timber sale design and advertisement. The result has been heightened competition amongst bidders for timber sales and the DNR timber sale program has benefited. The DNR is well-advised to maintain regular dialogue with state timber purchaser groups and industry associations in order to inform optimum responsiveness to market changes and customer needs. While niche market timber purchasers will continue to play an important role in the timber sale program, it is also apparent from analysis of survey responses that most purchasers regularly buy timber sales of mixed species, sizes, and qualities in order to combine raw material procurement for milling operations with exploitation of log resale opportunities to other buyers. Many respondents actually indicated a preference for such diversity in timber sale offerings; citing flexibilities in harvest timing and product type versatility as sources of enhanced uncut timber value.
Lacking currently, however, among purchasers is broad interest in east side pine species. While only a few respondents reported past purchases of pine, more positive respondent interest in future purchase opportunities for east side logs may signal a shift to more pine purchases if reliable and sufficient supplies are made available. Special effort to provide such supplies to existing and potential purchasers will be warranted.
As a result of policy changes, annual timber harvest volumes from federal forest lands have declined in Washington to only 5% of 1988 levels but a forest health emergency on these lands has resulted in new political pressure to increase harvest. A substantive increase in available federal timber could improve forest health and provide opportunities for economic development; however, abrupt increases to timber supply would have negative impacts for log markets in the region. When survey respondents were asked if they thought that volumes of timber would likely increase from federal lands, 63% indicated this was unlikely or impossible and 21% responded that they were uncertain. Interviews with forestry professionals suggest that similar opinions are widely held in the region. Review of the literature also confirms that any near term increases in federal timber harvest are unlikely to be of sufficient magnitude to influence regional market dynamics.
Important to purchasers are timber sale contract arrangements. Most purchasers agree that timber sales should be 1-5 MMBF in volume with a contract life of 3 years. More than 70% prefer scale sales. 35% indicate that lump sum sales are also acceptable under some circumstances. While there is little general interest in other timber sale types, it is apparent that a subset of purchasers may pay a premium for contract/direct and log yard sales that offer specific products on an occasional basis.
Purchasers have good reason to want timber sales that have flexible operational contract arrangements. Survey responses and mill interviews revealed that there is broad agreement that the ability to secure multiple year timber sales is critical to the inventory needs of successful forest products manufacturing businesses. When a mill is able to buy many sales with different operational windows, different species, and different prices, it has maximized its ability to respond to market fluctuations while ensuring that needed raw material supplies will be consistently available. The cumulative supply line represented by timber sales planned but as yet unsold combined with timber sales sold and under contract but not yet harvested is sometimes referred to in the industry as the “pipeline.” Without continuity of timber flow through the “pipeline”, milling infrastructure and timber sales programs become unstable as occurred in the 1990’s. Adequate pipeline volumes and multiple year timber sale contracts also benefit the DNR by encouraging speculative bidding and promoting manufacturing investment.
The market and infrastructure challenges for increases to the DNR harvest program that may be of greatest concern are the sale and utilization of the minority log types resulting from the harvest of larger and very small diameter trees. Fortunately for trust beneficiaries, the yields of large and very small diameter logs appear to be a relatively small percentage of the total timber volume to be offered for sale (less than 10%). Aggressive and innovative marketing strategies are warranted for these log types. For large logs the strategy should be to identify and supply existing purchaser markets. For small logs the strategy should be to work with private and public interests to encourage development of new utilization infrastructure.
While some select markets still exist for large logs, sale of very small logs, 3 to 5 inches in diameter, will likely remain a challenge. The currently unfavorable economics of biomass-to-energy projects, the continuing decline of the Pacific Northwest pulp and paper industry, the high cost of harvest and production, the relative lack of regional engineered wood production capacity, and the transportation challenges that isolate many forest areas of Washington are all factors that undermine the potential for profitable utilization of small logs in the near term. In the absence of sufficient federal harvest assurances, infrastructure investment incentives, and price supports for alternate energy projects, private sector investment in specialized industrial capacity to absorb small diameter low value logs has not been forthcoming. However, survey results indicate that purchasers have interest in new investment if reliable and adequate log supplies will be made available. In eastern Washington, new forest health contracting flexibilities combined with new management targets created by amendments to the HCP should mean that greater and consistent volumes of small diameter logs from state lands will be available. DNR will be well advised to look for ways to cooperate with federal, state, tribal, and local forest health and economic development interests that seek to create new incentives for small log utilization programs for energy, paper products, or engineered wood products.
While it would appear that regional wood products manufacturing infrastructure has stabilized and may even be expanding with scheduled construction of several new mills in the area (Stevens 2005), a closer look will reveal that there is more to the story. Sawmill expansions and start ups occur for many reasons. 2003 and 2004 were profitable years for many sawmills. Some sawmills may be choosing to reinvest profits in upgrades so that they might reduce corporate tax liabilities. Many logs from Washington are traveling to mills in other states, but some out-of-state mills are establishing new facilities in Washington to stay competitive by reducing transportation costs. New saw mill facilities planned or under construction in Washington, have been exclusively located on the west side of the Cascade Mountains. It is uncertain if these new facilities will bring market benefit to east side forests where loss of milling infrastructure appears to not yet be over (Associated Press 2005, Random Lengths 2005, Dietz 2004). Moreover, on the west side, while saw mill expansions and new construction would appear to represent new capacity, it may be that these new facilities are an extension of the regional progression described by Perez-Garcia (2005): the number of mills decreases while surviving companies increase in size and production outputs. One billion board feet of milling capacity is being added in the near term to the western Washington sawmill industry, yet no proportionate increase in available log supplies has been predicted. At least for the short term this may bring market benefit to the DNR timber sale program as new mills compete aggressively to establish pipeline inventories. Without increases in available log supplies, however, one mill must close such that another might open. The continuing decline of the pulp and paper industry represents a critical challenge to the region as well. New milling capacity means that more chips and hog fuel are produced in the face of slowing consumption effectively lowering the market price of these important sawmill byproducts as well as the market for pulp logs. New infrastructure is sorely needed in Washington for low value wood biomass utilization (pulp, chips, hog fuel, SDT) if a strong forest products industry is to be available in the future.
Declines in the dollar result in less competitive advantage for Canadian products and greater American-made lumber access to export markets which should support higher stumpage for DNR logs. Since 2002, the U.S. dollar has lost 36% against the euro, 25% against the Canadian dollar, and 23% against the yen. With low interest rates and record housing starts, improvements in domestic lumber prices as compared to recent years should continue to support modest gains in DNR log prices. As lumber prices increase, mills increase production and temporary shortages of log inventories result. The DNR timber sales group should move quickly to exploit sales of particular product types in response to such spot market opportunities. For example, in 1995, pulp log prices spiked dramatically. Companies that responded quickly with increased harvests were able to generate profits from forest stand improvement activities that might otherwise have been cost-prohibitive. Seasonal shortages represent another temporal sales opportunity. Some timber purchasers report that logs are more likely to be temporarily scarce at certain times of the year. DNR coordination of its marketing program with such periodic market shortfalls will positively influence stumpage return potentials and could help insure the success of forest health and fuels reduction harvest activities.
Some purchasers suggest that greater DNR investment to assure accuracy of estimated log qualities and volumes as described in DNR timber sale advertisements would increase purchaser confidence. Higher purchaser confidence results in less perceived risk. Less risk means greater value to the purchaser and improved returns to the trust beneficiaries. Greater investments in cruise time by field staff as well as in emerging technologies that estimate wood quality can help to provide more explicit and accurate timber sale descriptions (Fibre-Gen. 2005).
100% of purchasers indicate that cubic volume metrics are not desirable for timber sale measurements. In total disregard of findings in the literature of scaling inaccuracies associated with Scribner volume estimates, timber purchasers are clear: timber sales should be offered based upon Scribner volume estimates except for sales where majority volume is pulp. Pulp sales may be offered in tons.
Purchasers responding to the survey associated with this investigation are clear about contracting preferences in regards to sale volume, sale duration, and other purchase arrangements. While some sales, such as forest health sales, will logically benefit from new contract logging flexibilities that result in sales of log decks, sales of this type are not what most purchasers prefer and subsequently should be reserved for special circumstances. Available literature on log yards was reviewed to assess merchandizing potential for adding value to DNR stumpage returns. Log yards were found to be costly to operate and unlikely to improve net revenues unless most of the log volume processed is high value and larger logs.
As a consequence of large intense forest fires in eastern Washington over recent years, considerable public attention is being directed at the question of how to reduce hazardous fuel loads from the overly dense forests that characterize the region (DNR 2004). Removal of the many small trees that make up these fuel loads is known to be costly. However, research findings indicate that comprehensive restoration prescriptions that selectively target for removal a combination of small and large diameter trees may be economically and environmentally desirable in overstocked fire-prone ecosystems where failure to reduce fuel loads can result in stand replacement wildfires (Brown et al. 1996, Fiedler et al. 1999, Fiedler et al. 2001). DNR should attempt as possible to design forest health timber sales that combine timber yields such that a viable economic activity results in desired environmental conditions. Where needed, new contracting flexibilities will allow DNR to contract fuels removals for forest health with revenue recovery occurring from the sale of harvested logs after treatment. Purchasers suggest that DNR thinning sales that allow operators to select trees for removal based upon harvest prescriptions as opposed to DNR selection through tree painting will reduce timber removal uncertainties and costs while lowering sale preparation costs for DNR.
The apparent growing shortage of trained and qualified natural resource managers, loggers, and mill workers combined with a lack of economic opportunities in rural communities should be of great concern to the DNR and other forest management agencies and companies. Confounding this situation, personnel shortages come at a time when there is question as to whether the current share of 25% of gross revenues will provide adequate operating funds to maintain DNR productivity in the face of rising management costs (Independent Review Committee 2004). With personnel and funding shortages, there is concern that DNR will be unable to meet its expanded harvest targets. Failure to meet harvest targets will result in increased economic and environmental costs for Washington. Trust beneficiaries will see reduced return on asset values, fire fighting costs will continue to climb, habitats for sensitive species will be destroyed by fire, insects and other disturbances, and rural communities will continue to experience high unemployment. Educational partnerships between the DNR, the forest products industry, and institutions of higher learning for the purpose of recruiting young people into resource management careers can help to ensure that an adequate work force will be available in the future. Establishment of state scholarship programs anchored in work commitments and employment recruitments such as the federal Student Career Experience Program (SCEP) (USDA Forest Service 2004) represent important opportunities for investment in the sustainable management of Washington forests. Additional revenues generated from maximizing timber sale stumpage returns while minimizing administrative costs may help to provide some funding relief for the DNR.
Third party certification of the management of state forest lands in western Washington is being considered by the Public Lands Commissioner. While there may be valuable public relations benefits from state investment in the certification process, this investigation found little evidence that premium prices or broader markets would result from investments in forest certification. The majority of purchaser survey respondents agreed with only a few willing to pay a premium for certified logs. As yet it is unknown what the implications of certification on west side DNR forestlands may be for implementation of forest health programs and the subsequent sale of uncertified logs from DNR managed forests on the east side.
The DNR sustainable harvest level is being challenged in court. If the courts rule against the department, harvest levels could be reduced along with revenues which would likely compromise implementation of forest health programs in eastern Washington. Effective implementation of forest health activities will be dependent upon the success of the entire state timber sale program to ensure that needed markets, infrastructure, funding, and personnel resources are available from a viable regional forest products industry.
Calls for forest certification and filings of law suits are indication that some influential elements of the Washington public have not been adequately informed about the environmental protections required by the State’s forest practice regulations and Habitat Conservation Plan. Washington forests are managed under the strictest regulatory protections of any state forests in the U.S. As well, there is also growing recognition that the use of wood from forest harvests in place of alternative building materials may yield environmental benefits. For example, by using wood in residential construction rather than nonrenewable structural materials such as steel, aluminum, concrete, brick, and plastics, which are energy intensive to manufacture, less fossil fuel is consumed and emissions of carbon to the atmosphere are reduced (CORRIM 2004). Further, forest management activities that reduce wildfire risk lower the potential for carbon emissions to the atmosphere while protecting clean water. Information contained in this investigation, about the magnitude of the many market and non-market benefits, direct and indirect job multipliers, tax revenues, and economic develop opportunities associated with DNR harvest activities, should have broad review so that the consequences of adjustments in DNR management activities are widely known and given serious public consideration. Further research should continue investigation of the marginal social, economic, and environmental trade-offs associated with public resource management choices.
The forest products industry in the Pacific Northwest appears to be mature with most companies in business for decades and little opportunity for new entry; especially by small businesses. Major sectors such as pulp and paper and plywood industries continue to experience declines in productive capacity. Evidence presented in this report suggests that such declines will continue. While productive capacity of the sawmill industry appears to have grown, the number of companies in operation has been reduced and mill closures still occur. This is particularly true for eastern Washington. The need for forest health activities has resulted in an imperative to develop new regional forest product infrastructure to utilize small diameter timber. In partial response, there is growing public interest in forest biomass utilization as energy generating feedstock. Government price supports combined with increased fossil fuel prices may improve competitiveness of biomass-to-energy economics. Engineered wood products (EWP) are rapidly gaining market share (Adair 2004) and could provide economically attractive opportunities for utilization of small diameter timber and low value wood biomass but investment in new infrastructure is needed.
The forest products industry has undergone dramatic adjustments during the last decade that continue today. Generally there are much fewer players and the spectrum of product operations has narrowed. However, a large and viable forest products industrial sector remains. This investigation finds that aggressive timber sale marketing adapted to changing purchaser needs and preferences can maximize returns to trust beneficiaries while supporting greater opportunities for utilization of all log species, sizes, and qualities. As the largest public timber supplier in Washington, the DNR is well-positioned to provide reliable and attractive timber sale opportunities for purchasers throughout the region which will result in significant state revenues, environmentally responsible opportunities for economically viable forest management, encouragement for investment in needed regional infrastructure, and many other important public values including wildfire risk reduction.
References Cited In This Report
- Acker, S., T. Sabin, L. Ganio, and W. McKee. 1998. Development
of old-growth structure and timber volume growth trends
in maturing Douglas-fir stands. Forest Ecology and Management
104 (1/3).
- Adair. C., 2004. Regional Production and Market Outlook.
Structural Panels and Engineered Wood Products 2004-2009.
APA – The Engineered Wood Association. Tacoma, WA. http://www.apawood.org/
- Agee, J. 1993. Fire ecology of Pacific Northwest forests.
Washington D.C.: Island Press. 493 pp.
- Anderson, R. and E. Hansen. 2004. Determining Consumer
Preferences for Ecolabeled Forest Products. Journal of
Forestry. Vol.102(4).
- Antares Group Inc. 2003. Assessment of Power Production
at Rural Utilities Using Forest Thinnings and Commercially
Available Biomass Power Technologies. Prepared for: USDA,
USDOE, NREL.
- Arno, S. 2000. Fire in Western Forest Ecosystems. In:
Brown, J., Smith, J. (Eds.), Wildland Fire in Ecosystems:
Effects of Fire on Flora (Pp 97-120). (RMRS-GTR-42: vol.
2). USDA Forest Service. http://www.fs.fed.us/rm/pubs/rmrs_gtr42_2.html
- Al-Khattat, I. 2002. Small Diameter Timber: The Ultimate
Engineering Solution. In proceedings: Small Diameter Timber:
Resource Management, Manufacturing, and Markets. WSU Coop
Ext. Pullman, WA.
- Associated Press. 2005. Historic Yakima Sawmill Shutting
Down. In: The Seattle P.I. March 3, 2005. http://seattlepi.nwsource.com/business/214247_sawmill03.html
- Aust P. 2004. Economic and Revenue Forecast. Washington
Department of Natural Resources. Olympia, WA. http://www.dnr.gov/
- Babbitt, B. and D. Glickman. 2000. Managing the impacts
of wildfires on communities and the environment: A report
to the President. http://www.fs.fed.us/fire/nfp/president.shtml.
- Bailey, J. and J. Tappeiner. 1998. Effects of thinning
on structural development in 40- to 100-year-old Douglas-fir
stands in western Oregon. Forest Ecology & Management.
Vol.108.
- Baird, M., D. Zabowski, and R. Everett. 1999. Wildfire
effects on carbon and nitrogen in inland coniferous forests.
Plant and Soil. Vol.209.
- Barbour, J., R. Fight, G. Christensen, G. Pinjuv, and
R. Nagubadi. 2004. Thinning and Prescribed Fire and Projected
Trends in Wood Product Potential, Financial Return, and
Fire Hazard in Montana. Gen. Tech. Rep. PNW GTR 606. Portland,
OR.: USDA Forest Service, Pacific Northwest Research Station.
- Barbour, J. 1999. Relationship Between Diameter and
Gross Product Value for Small Trees. In proceedings: 27th
Wood Technology Clinic & Show. Portland, OR.
- Bergvall, J. and D. Gedney. 1970. Washington Mill Survey
1968. A joint study by the Washington Department of Natural
Resources and the Pacific Northwest Forest and Range Experiment
Station. Olympia, WA.
- Bergvall, J., L. Gee, and K. Minneman. 1979. 1978 Washington Mill Survey. Division of Technical Services. Washington Department of Natural Resources. Olympia, WA.
- Bigley, R. and S. Hull. 1998. Site Productivity; Can
It Go Up in Smoke? WA DNR Forest Management Forum. http://www.dnr.gov/htdocs/adm/comm/DNR
News/march02/bigley.pdf
- Blatner, K., C. Keegan, S. Shook, and F. Wagner. 2003.
Washington’s Forest Products Industry: Current Conditions
and Forecast 2003. Washington State University Cooperative
Extension. Pullman, WA. http://cru.cahe.wsu.edu/CEPublications/misc0511/misc0511.pdf
- Bolsinger, C., N. McKay, D. Gedney, and C. Alerich.
1997. Washington’s Public and Private Forests. Resource
Bulletin. PNW-RB-218. Portland, OR: USDA Forest Service.
Pacific Northwest Research Station.
- Brown, C. and L. Kellog. 1996. Harvesting economics
and wood fiber utilization in a fuels reduction project:
a case study in eastern Oregon. Forest Products Journal.
Vol.46(9).
- Buchanan, J., and W. Keye. 1997. How do you want your
smoke? California Forests, July/August 1997. California
Forestry Association.
- Camp, A. 1995. Predicting late successional fire refugia
from physiography and topography. Ph.D. diss., University
of Washington, Seattle, WA. 137pp.
- Carey, A. 1998. Ecological foundations of biodiversity:
lessons from natural and managed forests of the Pacific
Northwest. Northwest Science 72 (special issue).
- Carey, A., D. Thysell, and A. Brodie. 1999a. The forest
ecosystem study: background, rationale, implementation,
baseline conditions, and silvicultural assessment. Gen.
Tech. Rep. PNW GTR 457. Portland, OR.: USDA Forest Service,
Pacific Northwest Research Station.
- Carey, A., J. Kershner, B. Biswell, and L. Dominguez
de Toledo. 1999. Ecological scale and forest development:
Squirrels, dietary fungi, and vascular plants in managed
and unmanaged forests. Supplement to: The Journal of Wildlife
Management, Vol. 63 No. 1: Wildlife Monographs, No 142,
January 1999.
- Carey, A., C. Elliot, B. Lippke, J. Sessions, C. Chambers,
C. Oliver, J. Franklin, and M. Raphael. 1996. Washington
Forest Landscape Management Project – A Pragmatic,
Ecological Approach to Small Landscape Management. Report
No. 2. USDA Forest Service, Washington State Department
of Fish and Wildlife and Washington State Department of
Natural Resources, Olympia, WA. Pp. 99
- Center for Business and Industry Studies. 2004. Pulp
Mills, Pulp & Paper Mills, Paper Mills in WA, OR, and
ID. http://www.paperstudies.org
- Center for Business and Industry Studies. 2004. Today’s
paper industry – Its character and structure. http://www.paperstudies.org
- Center for International Trade in Forest Products (CINTRAFOR).
(1998). Disparity in Timber Rural vs. Urban Income in Washington
State Rising. CINTRAFOR Fact Sheet #36. http://www.cintrafor.org/RESEARCH_TAB/links/Fs/FS36.htm
- Chandler, M. 2004. Estimated Small Log Logging Costs
for Eastern Washington. Email communication.
- Center for International Trade in Forest Products (CINTRAFOR). 1998. Disparity in Timber Rural vs. Urban Income in Washington State Rising. CINTRAFOR Fact Sheet #36.Unversity of Washington College of Forest Resources. Seattle,WA. http://www.cintrafor.org
- Clemons, C. 2002. Wood-Plastic Composites in the United
States; the Interfacing of Two Industries. Forest Products
Journal. Vol. 52(6).
- Clones, D., C. Rist. 1997. Development Report Card for
the States, eleventh edition. Corporation for Enterprise
Development.
- Commission on Old Growth Alternatives for Washington’s
Forest Trust Lands. 1989. Final Report. Olympia, WA.
- Comnick, J., M. McKinley, and D. Emmons. 2005. Final
Report on the Project to Certify the University of Washington
Charles Lathrop Pack Forest under the Sustainable Forestry
Initiative. University of Washington College of Forest
Resources. Seattle, WA.
- Conway R. 1994. The Forest Products Economic Impact
Study Current Conditions and Issues. Prepared for Washington
Forest Protection Association, Washington Department of
Natural Resources, and Washington Department of Trade and
Economic Development. Olympia, WA.
- Cooper, C. 1960. Changes in vegetation, structure, and
growth of southwestern pine forests since white settlement.
Ecol. Monogr.
- Courtney S., J. Blakesley, R. Bigley, M. Cody, J. Dumbacher,
R. Fleischer, A. Franklin, J. Franklin, R. Gutiérrez,
J. Marzluff and L. Sztukowski. 2004. Scientific evaluation
of the status of the Northern Spotted Owl. Sustainable
Ecosystems Institute, Portland, OR. http://www.sei.org/owl/finalreport/finalreport.htm
- CORRIM. 2004. The Consortium for Research on Renewable
Industrial Materials.
http://www.corrim.org/reports/
- Cubbage, F., S. Moore, J. Cox, L. Jervis, J. Edeburn,
D. Richter, W. Boyette, M. Thompson, and M. Chesnutt. 2003.
Forest Certification of State and University Lands in North
Carolina; a Comparison. Journal of Forestry. Vol. 101(8).
- Curtis, R., D. DeBell, C. Harrington, D. Lavender, J.
Tappeiner, and J. Walstad. 1998. Silviculture for multiple
objectives in the Douglas fir region. Gen. Tech. Rep. PNW
GTR 435. Portland, OR.: USDA Forest Service, Pacific Northwest
Research Station.
- Dietz, D. 2004. Area Businessmen Buy Sawmill. The Register
Guard. Eugene, OR. http://www.registerguard.com
- Dooley, J. 2002. Technical Products from Small Diameter
Timber for Habitat Enhancement and Watershed Restoration.
In proceedings: Small Diameter Timber: Resource Management,
Manufacturing, and Markets. WSU Coop Ext. Pullman, WA.
- DNR. 2004. A Desirable Forest Health Program for Washington’s
Forests. Forest Health Strategy Work Group Report.
- DNR. 2004. HCP Amendment No. 1. Administrative Amendment
to the Northern Spotted Owl Conservation Strategy for the
Klickitat HCP Planning Unit. Ellensburg, WA. http://www.dnr.wa.gov
- DNR. 2004. Final Environmental Impact Statement on Alternatives
for Sustainable Management of State Trust Lands in Western
Washington. Olympia, WA. http://www.dnr.wa.gov/htdocs/fr/sales/sustainharvest/sustainharvest.html
- DNR. 2004. Sutherland to Seek “Green” Certification
for State Trust Forests in Western Washington. DNR Press
Release. Olympia, WA.
http://www.dnr.wa.gov/htdocs/adm/comm/nr04_087.htm
- DNR. 2004. Public access and recreation on state lands.
Fact Sheet No. 04-185.
http://www.dnr.wa.gov/htdocs/adm/comm/fs04_185.htm
- DNR. 2004. Strategic Plan for the Department of Natural Resources 05-07 Biennium. http://www.dnr.gov/base/publications/list.html
- DNR. 2003. Washington Forest Health Issues in 2003. http://www.dnr.wa.gov/htdocs/rp/forhealth/2003fhhighlights/fhgencondinter.html
- DNR. 2003. Lands Commissioner Doug Southerland announces
next step in independent assessment of state trust land
forestry. DNR Press Release. Olympia , WA. http://www.dnr.wa.gov/htdocs/admin/comm/nr03_095.htm
- DNR. 2003. 2004. Annual Fire Statistics
- DNR. 2003. Processors Survey 2000-2002.
- DNR. 2002. “Forest Health” sales preparation
time reduced by 75%. DNR News Spring 2002. http://www.wa.gov/dnr/htdocs/adm/comm/DNRNews/march02/foresthealthsales.html
- DNR. 1997. Final Habitat Conservation Plan. Olympia,
WA. Pp. 223.
- Dramm, J., R. Govett, T. Bilek and G. Jackson. 2004.
Log Sort Yard Economics, Planning, and Feasibility. Gen.
Tech. Rep. FPL-GTR-146. Madison, WI: USDA Forest Service.
Forest Products Laboratory. http://www.fpl.fs.fed.us
- Dramm, J., G. Jackson and J. Wong. 2002. Review of Log
Sort Yards. Gen. Tech. Rep. FPL-GTR-132. Madison, WI: USDA
Forest Service. Forest Products Laboratory. http://www.fpl.fs.fed.us
- Dramm, J. 2002. Small Log Sawmilling 101. Powerpoint.
Madison, WI: USDA Forest Service. State and Private Forestry. http://www.forestprod.org/smallwood02_dramm.pdf
- Eckelman, C. and E. Haviarova. 2002. Buildings and Furniture
Constructed with Round Mortise and Tenon Joints from Salvage
Materials and Small Diameter Timber. In proceedings: Small
Diameter Timber: Resource Management, Manufacturing, and
Markets. WSU Coop Ext. Pullman, WA.
- Elliot, W. and I. Miller. 2002. Estimating erosion impacts
from implementing the National Fire Plan. Paper 02-5011.
St. Joseph, MI: American Society of Agricultural Engineers.
- Emergent Solutions and Christopher Allen & Associates.
2003. Pre-Feasibility Assessment. Small Diameter Underutilized
(SDU) Wood Feedstock for a 10 MW Co-Generation Facility
at the Milltown Dam Site. Prepared for: USDA Forest Service,
Montana Community Development Corporation, and Bonner Development
Group. http://www.mtcdc.org
- Emergent Solutions and Christopher Allen & Associates.
2003. SDU Wood as Feedstock for Biomass Conversion in Western
Montana. Prepared for: USDA Forest Service and Montana
Community Development Corporation. http://www.mtcdc.org
- Erikson, R., T. Gorman, D. Green, and D. Graham. 2000.
Mechanical Grading of Lumber Sawn from Small-Diameter Lodgepole
Pine, Ponderosa Pine, and Grand Fir Trees from Northern
Idaho. Forest Products Journal. 50(7/8).
- Everett, R., R. Schellhaas, D. Keenum, D. Spurbeck,
and P. Ohlson. 2000. Fire history in the ponderosa pine/Douglas-fir
forests on the east slope of the Washington Cascades. Forest
Ecology and Management. Vol.129
- FEMAT (Forest Ecosystem Management Assessment Team).
1993. Forest ecosystem management an ecological, economic,
and social assessment. Portland, OR: USDA ; USDI [and others].
- Fibre-Gen. 2005. www.fibre-gen.com
- Fiedler, C., C. Keegan III, C. Woodall, T. Morgan, S. Robertson, and J. Chmelik. 2001. A strategic assessment of fire hazard in Montana. Joint Fire Sciences Program Report. University of Montana. Missoula, MT. http://www.bber.umt.edu/forestproducts/pdf/MTfiresreport.pdf
- Fiedler, C., C. Keegan III, D. Wichman, and S. Arno.
1999. Product and economic implications of ecological restoration.
Forest Products Journal. Vol.49(2).
- Fletcher, R., M. Rickenbach, and E. Hansen. 2002. Forest
Certification in North America. Oregon State University
Extension Service Publication. Oregon State University.
- Forsyth, K., D. Haley, and R. Kozak. 1999. Will Consumers
Pay More for Certified Wood Products? Journal of Forestry
Vol.97(2).
- Franklin, J., T. Spies et. al., 2002. Disturbances and
structural development of natural forest ecosystems with
silvicultural implications, using Douglas-fir forests as
an example. Forest Ecology and Management 5624: 1-25.
- Gammell, T. and R. Bremer. 2004. Northwest Pulp Mills
and Export Facilities 1989-2002. Forest Resources Assoc.
Portland, OR.
- Garman, S., J. Cissel, and J. Mayo. 2003. Accelerating
development of late-successional conditions in young managed
Douglas-fir stands: A simulation study. Gen. Tech. Rep.
PNW GTR 557. Portland, OR.: USDA Forest Service, Pacific
Northwest Research Station.
- Government Accounting Office. 1999. Western national
forests: A cohesive strategy is needed to address catastrophic
wildfire threats. (GAO/GCED-99-65). http://www.gao.gov/
62pp.
- Graham, R. (Ed.) 2002. Interim Hayman fire case study
analysis: Executive Summary. USDA Forest Service, Rocky
Mountain Research Station.
- Graf, A. and T. Koehler. 2000. Oregon Cellulose-Ethanol
Study. An Evaluation of the Potential for Ethanol Production
in Oregon Using Cellulose-Based Feedstocks. Prepared for
the Oregon Office of Energy. Portland, OR.
- Han, H., H. Lee, L. Johnson, R. Folk, T. Gorman, J.
Hinson, and G. Jackson. 2002. Economic feasibility of small
wood harvesting and utilization on the Boise National Forest:
Cascade, Idaho City, Emmett Ranger Districts. Department
of Forest Products, College of Natural Resources, University
of Idaho. Moscow, ID.
- Hansen, E. 1997. Forest certification and its role in
marketing strategy. Forest Products Journal. Vol. 47(3).
- Harrington, C. 2003. The 1930s Survey of Forest Resources
in Washington and Oregon. Gen. Tech. Rep. PNW-GTR-584.
Portland, OR: USDA Forest Service. Pacific Northwest Research
Station. http://www.fs.fed.us/pnw/publications/gtr584/gtr584.pdf
- Hayes, J., S. Chan, W. Emmingham, J. Tappeiner, L. Kellogg,
and J. Bailey. 1997. Wildlife response to thinning young
forests on the Pacific Northwest. Journal of Forestry Vol.95(8).
- Haynes. R. (Tech. Coordinator), 2003. An Analysis of
the Timber Situation in the United States: 1952-2050. Gen.
Tech. Rep. PNW-GTR-560. Portland, OR: USDA Forest Service.
Pacific Northwest Research Station.
- Heiken, D. 2003. A synthesis of published articles on
young stand management. Oregon Natural Resource Council:
Eugene, OR. http://www.efn.org/~onrcdoug/THINNING_SCIENCE.htm
- Hill, B. 1998. Western national forests catastrophic
wildfires threaten resources and communities. (GAO/TRCED-98-273). http://www.gao.gov.
- Hunter, M. 2001. Communiqué No. 3: Management in young forests. Cascade Center for Ecosystem Management: Corvallis, OR. http://www.fsl.orst.edu/ccem/pdf/Comque3.pdf
- Ice, G., D. Neary, and P. Adams. 2004. Effects of Wildfire
on Soils and Watershed Processes. Journal of Forestry.
Vol.102(6).
- Independent Review Committee. 2004. State Trust Land
Management: An Evaluation of Effectiveness and Efficiency.
A report from the Independent Review Committee to the Commissioner
of Public Lands. Olympia, WA. http://www.dnr.gov
- Irland, L. 1993. Wood producers face green marketing
era. Wood Technology Vol.3(4).
- Johnson, C., R. Clausnitzer, P. Mehringer, and C. Oliver.
1994. Biotic and abiotic processes of eastside ecosystem:
the effects of management on plant and community ecology,
and on stand and landscape vegetation dynamics. Gen. Tech.
Rep. PNW-GTR-322. Portland, OR: USDA Forest Service. Pacific
Northwest Research Station.
- Johnson, K., J. Franklin, J. Thomas, J. Gordon. 1991.
Alternatives for the management of late-successional forests
of the Pacific Northwest. A report to the Agriculture Committee
and the Merchant Marine and Fisheries Committee of the
U.S. House of Representatives. Pp. 59
- Kamarata, D. 2002. Utilization of Small Diameter Ponderosa
Pine in the Transportation Industry. In proceedings: Small
Diameter Timber: Resource Management, Manufacturing, and
Markets. WSU Coop Ext. Pullman, WA.
- Keegan III, C., C. Fiedler and T. Morgan. 2004. Wildfire
in Montana: Potential hazard reduction and economic effects
of a strategic treatment program. Forest Products Journal.
Vol.54(7/8).
- Keegan, C., D. Wichman, D. Van Hooser, T. Gorman, F.
Wagner, P. Polzin, and A. Hearst. 1997. Idaho’s forest
products industry: A descriptive analysis, 1979-1996. University
of Montana, Bureau of Business and Economic Research. Pp.22-45.
- Kerstetter, J. and J. Lyons. 2001. Logging and Agricultural
Residue Supply Curves for the Pacific Northwest. WSU Energy
Program for USDOE. Pullman, WA.
- Kinstrey, R. 2004. Invest to Improve: North America
Struggles to Maintain its Global Cost Competitiveness.
Pulp and Paper. Jan. 2004. www.paperloop.com
- Kluender, R., D. Lortz, W. McCoy, B. Stokes and J. Klepac.
1998. Removal intensity and tree size effects on harvesting
cost and profitability. Forest Products Journal. Vol.48(1).
- Lamm, G. 2005. Logging rises on public land. Puget Sound
Business Journal. Jan. 10, 2005.
- Larsen, D. 2003, 2000, 1998, 1992. Washington Mill Surveys
for 1998, 1996, 1992, 1988. Washington Department of Natural
Resources. Olympia, WA. http://www.dnr.gov/
- Laverty, L.and J. Williams. 2000. Protecting people
and sustaining resources in fire-adapted ecosystems, a
cohesive strategy. USDA Forest Service publication. 85pp. http://www.fs.fed.us/
- Lincoln Industrial. 2004. 4’ Portable Veneer Mill.
terryk
 skillworks.us
- Lindenmayer D. and J. Franklin 2003. Towards Forest
Sustainability. Island Press, Washington DC (co-published
with CSIRO Publishing). Pp. 244
- Lippke, B., J. Sessions, and A. Carey. 1996. Economic Analysis of Forest Landscape Management Alternatives. CINTRAFOR Special Paper 21. University of Washington College of Forest Resources. Seattle, WA. http://www.cintrafor.org
- Lippke B. and R. Conway. 1994. Economic Impact of Alternative
Forest Practice Rules to Protect Northern Spotted Owl Sites.
Prepared for the Wildlife Committee of the Forest Practices
Board. State of Washington. Olympia, WA.
- Livingston, J. 2004. Small Diameter Success Stories.
Madison, WI: USDA Forest Service. Forest Products Laboratory.
- Lockwood-Post. 2003 and 1988. Directory of the Pulp,
Paper, and Allied Trades. Vance Pub. Corp. New York, NY.
- Log Lines. 2004. 2004 Statistical Yearbook. Mount Vernon,
WA. http://www.loglines.com
- Lowell, E., S. Willits, and R. Krahmer. 1992. Deterioration
of Fire-killed and Fire-damaged Timber in the Western United
States. Gen. Tech. Rep. PNW-GTR-292. Portland, OR: USDA
Forest Service. Pacific Northwest Research Station.
- Lynch, D. 2004. What do Forest Fires Really Cost? Journal
of Forestry. Vol.102(6).
- Mapes, L.V., J. Mayo. 2002. The Economic Divide: Most
of the state missed out on the boom times of the 90’s.
Seattle Times Report. May 8, 2002. http://seattletimes.nwsource.com/html/home/
- Mason, L., K. Ceder, H. Rogers, T. Bloxton, J. Comnick,
B.Lippke, J. McCarter, and K. Zobrist. 2003. Investigation
of Alternative Strategies for Design, Layout and Administration
of Fuel Removal Projects. Rural Technology Initiative,
College of Forest Resources, University of Washington.
Seattle. 78pp
- Mater, C., V. A. Sample, J. Grace, and G. Rose. 1999.
Third-Party Performance-Based Certification. Journal of
Forestry Vol.97(2).
- Mater Engineering Ltd. 2002. Markets and Processing
Options for Small Diameter Trees. COPWRR Report Synopsis.
- Mclain, W. 1996. Logging utilization, Idaho, 1990. (INT-RB-86)
Ogden, UT: USDA Forest Service, Intermountain Research
Station Research Bulletin.
- McKenzie, D., Z. Gedalof, D. Peterson, and P. Mote.
2004. Climate Change, Wildfire, and Conservation. Conservation
Biology.18:4. pages 890-902.
- McNeil Technologies, Inc. 2003. Biomass Resource Assessment
and Utilization Options for Three Counties in Eastern Oregon.
Report to Oregon Department of Energy. Salem, OR.
http://www.energy.state.or.us/biomass/document/EOBRA/Part1.pdf
- Mosely, C. and S. Shankle. 2001. Who gets the work?
National Forest contracting in the Pacific Northwest. Journal
of Forestry Vol.99(9).
- Muir P.S. et. al. 2002. Managing for biodiversity in
young Douglas-fir forests of Western Oregon. Biological
Science Report. (USGS/BRD/BSR 2002 -0006). US Geological
Survey, Forest and Rangeland Ecosystem Science Center:
Corvallis, OR.
- National Fire Plan. 2004. http://www.fireplan.gov/
- Norton, G., Secretary of the Interior. 2002. Fire, Forests,
and the Department of the Interior. http://www.doi.gov/fire/firepresentation.pdf
- NW Management Inc. 2005. Log Market Report. http://www.consulting-foresters.com/
- Oliver, C. 1999. Sustainable Forestry; What is it? How do we achieve it? Journal of Forestry. Vol.101(5).
- Oliver, C. 1999. The future of the forest management
industry: Highly mechanized plantations and reserves or
a knowledge-intensive integrated approach? Forestry Chronicle.
Vol.75(2).
- Oliver, C. and B. Larson. 1996. Forest Stand Dynamics.
John Wiley & Sons, Inc.: New York, NY. Pp. 520
- Omi, P.N., & E.J. Martinson. 2002. Effect of fuels
treatment on wildfire severity. Joint Fire Sciences Program
Report. http://www.cnr.colostate.edu/FS/westfire/FinalReport.pdf
- Orchard, C. 1953. The cubic scale. The Lumberman. Vol.80(3).
- OSU and others. 2002. Assessment of Timber Availability
from Forest Restoration within the Blue Mountains of Oregon. http://www.fs.fed.us/bluemountains/pubs.htm
- Ozanne, L. and R. Vlosky. 2003. Certification from the
U. S. Consumer Perspective: A Comparison from 1995-2000.
Forest Products Journal. Vol. 53(3).
- Paun D. and D. Wright. 2001. Small Diameter Timber:
A Review of the Published Literature. CINTRAFOR Special
Paper 38. University of Washington College of Forest Resources.
Seattle, WA. http://www.cintrafor.org
- Paun D. and G. Jackson. 2000. Potential for Expanding
Small-Diameter Timber Market; Assessing Use of Wood Posts
in Highway Applications. Gen. Tech. Rep. FPL-GTR-120. Madison,
WI: USDA Forest Service. Forest Products Laboratory.
- Parry, D., G. Fillip, S. Willits, and C. Parks. 1996.
Lumber Recovery and Deterioration of Beetle-killed Douglas-fir
and Grand-fir in the Blue Mountains of Eastern Oregon.
Gen. Tech. Rep. PNW-GTR-376. Portland, OR: USDA Forest
Service. Pacific Northwest Research Station.
- Pease, D. 2003. Industry Profile: Paul Ehinger: Reluctant “Elder
Statesman.” Engineered Wood Journal. Spring 2003. http://www.apawood.org/level_b.cfm?content=pub_ewj_arch_main
- Perez-Garcia, J. 2005. A Preliminary Assessment of the
Lumber Manufacturing Sector in Washington State. In Deal,
R., White, S. (Eds.). Understanding key issues of sustainable
wood production in the Pacific Northwest. Gen. Tech. Rep.
PNW-GTR-626. Portland, OR: USDA Forest Service. Pacific
Northwest Research Station.
- Perez-Garcia, J. 2004. The Importance of Oregon’s
Forests in US and International Markets; Meeting the Needs
of Future Consumers of Forest Products and Environmental
Services. CINTRAFOR Special Paper 92. University of Washington
College of Forest Resources. Seattle, WA. http://www.cintrafor.org
- Petersen, J. 2004. We Can Start Today! Evergreen Magazine.
Spring 2004. http://www.evergreenmagazine.com/
- Pickell, B. 2004. Personal communication. Mr. Pickell
is the Director of the Washington Contract Loggers Association. http://www.loggers.com/
- Pfilf, R.J., J.F. Marker & R.D. Averill. (2002).
Forest health and fire: An overview and evaluation. Chantilly,
VA: National Association of Forest Service Retirees. http://www.fsx.org/NAFSRforesthealth.pdf
- Poage, N. and J. Tappeiner. 2002. Long-term patterns
of diameter and basal area growth of old-growth Douglas-fir
trees in Western Oregon. Canadian Journal of Forest Research
Vol.32 (7).
- Powell, D., V. Rockwell, J. Townsley, J. Booser, S.
Bulkin, T. Martin, B. Obedzinski and F. Zensen. 2001. Forest
density management recent history and trends for the Pacific
Northwest Region. (R6-NR-TM-TP-05-01). USDA Forest Service. http://www.fs.fed.us/
- Pyne, S. 1997. America's fires: Management on wildlands and forests. Forest History Society: Durham, NC. 54pp.
- Pyne, S. 1982. Fire in America: Cultural history of
wildland and rural fire. Princeton University Press.: Princeton,
NJ. 654pp.
- Random Lengths. 2005. Curtailment Watch; Lumber Mills-West. http://www.randomlengths.com/base.asp?s1=Daily_WoodWire&s2=Curtailment_Watch&s3=Lumber_Mills-West&pub=list
- Random Lengths. 2004 and 1988. Random Lengths Buyers’ and
Sellers’ Guide. The Big Book. Random Lengths Publications,
Inc. Eugene, OR.
- Rapp, V. 2002. Science update— Restoring complexity:
Second growth forests and biodiversity. USDA Forest Service,
Pacific Northwest Research Station: Olympia, WA.
- Rapraeger, E. 1950. The cubic foot as a national log-scaling
standard. Paper No. 24. Missuola, MT: USDA Forest Service.
Northern Rocky Mountain Forest and Range Experiment Station.
- Rebhan, P. 2004. Menominee Tribe sees little financial
return on forestry certification efforts. Greenbay Press
Gazette. http://www.greenbaypressgazette.com/news/archive/local_16345036.shtml
- Reiber, D. 2003. Deeper Shade of Green for Washington’s
Forests? Tidepool. http://www.tidepool.org/greentide/greent12203.cfm
- Renewable Fuels Association. 2004. Ethanol and Agriculture. http://www.ethanolrfa.org/factfic_ag.html
- Renewable Natural Resources Foundation. 2003-4. Federal
natural resource agencies confront an aging workforce and
challenges to their future roles. Renewable Resources Journal.
2 (14). http://www.rnrf.org
- Resource Information Systems Inc. (RISI). 2004. North
American Timber Forecast April 2004S. http://www.resourceinfo.com/ from
State Trust Land Management: An Evaluation of Effectiveness
and Efficiency. 2004. http://www.dnr.wa.gov/htdocs/agency/independent_review/
- Rummer, R., D. May, W. Sheppard, [and others]. 2003.
A Strategic Assessment of Forest Biomass and Fuel Reduction
Treatments in Western States. USDA Forest Service and the
Western Forestry Leadership Coalition. http://www.fs.fed.us/research/infocenter.html
- R.W. Beck Inc. 2003. Review of Biomass Fuels and Technologies.
Prepared for: Yakima County Public Works Solid Waste Division.
Yakima, WA.
- Salafsky N., R. Margoluis and K. Redford. 2001. Adaptive
Management: A Tool for Conservation Practitioners. http://fosonline.org/resources/Publications/AdapManHTML/Adman_1.html
- Sampson, R., M. Smith, and S. Gann. 2001. Western Forest
Health and Biomass Energy Potential. A Report to the Oregon
Office of Energy. The Sampson Group, Inc. Alexandria, VA.
- Seattle Press on Line. 2003. This summer is state’s
driest in more than a century. University of Washington
Press Release. http://www.seattlepress.com/article-10295.html
- Sessions, J., P Bettinger, R. Buckman, M. Newton, and
J. Hamann. 2004. Hastening the return of complex forests
following fire; the consequences of delay. Journal of Forestry.
Vol.102(3).
- Shook, S. 1999. Profile of the Pacific Coast Manufactured
Firelog Market. Forest Products Journal. Vol.49(11/12).
- Spelter, H. 2002. Sawmill Closures, Openings, and Net
Capacity Changes in the Softwood Lumber Sector, 1996-2003.
Research Paper. FPL-RP-603. Madison, WI: USDA Forest Service.
Forest Products Laboratory.
- Spelter, H. 2002. Conversion of board foot scaled logs
to cubic meters in Washington State, 1970-1998. Gen. Tech.
Rep. FPL-GTR-131. Madison, WI: USDA Forest Service. Forest
Products Laboratory.
- Spelter, H. and T. McKeever. 2001. Profile 2001: Softwood
Sawmills in the United States and Canada. Research Paper.
FPL-RP-594. Madison, WI: USDA Forest Service. Forest Products
Laboratory.
- Spelter, H., R. Wong and P. Ince. 1996. Economic Feasibility
of Products from Inland West Small-Diameter Timber. Gen.
Tech. Rep. FPL-GTR-92. Madison, WI: USDA Forest Service.
Forest Products Laboratory.
- Spies, T., and J. Franklin. 1991. The structure of natural
young, mature, and old-growth Douglas-fir forests in Oregon
and Washington. In: Ruggeri, L., K. Aubry, A. Carey, and
M. Huff (Eds.), Wildlife and vegetation of unmanaged Douglas-fir
forests. Gen. Tech. Rep. PNW-GTR-285. Portland, OR: USDA
Forest Service. Pacific Northwest Research Station.
- Stevens, J. 2005. Washington Ramps Up Mill Capacity.
The Campbell Group LLC. Timber Trends. Feb. 2005. http://www.campbellgroup.com/timber_research/pdf/Feb%2005%20Timbertrends.pdf
- Stewart, J. 1988. Forest insects and disease research:
What is needed? Presentation to Western Forestry and Conservation
Association Pest Committee, Seattle, WA.
- Stiffler, L. 2003. State to reconsider “green” logging
seal. Seattle Post-Intelligencer. http://seattlepi.nwsource.com/local/136741_timber27.html
- Sutherland, D. and B. Bare 2002. Sustaining Washington
State’s Forest Trust Lands: Today and Tomorrow. http://www.dnr.wa.gov/htdocs/adm/comm/forest_trust_lands_oped.htm
- Tappeiner, J., D. Huffman, D. Marshall, T. Spies, and
J. Bailey, 1997. Density, ages, and growth rates in old-growth
and young-growth forests in coastal Oregon. Canadian Journal
of Forest Research 27.
- The White House. 2003. President Bush Signs Healthy
Forests Restoration Act into Law. http://www.whitehouse.gov/infocus/healthyforests/
- Thomas, J., E. Forsman, J. Lint [and others]. 1990.
A conservation strategy for the northern spotted owl: a
report of the Interagency Scientific Committee to address
the conservation of the northern spotted owl. Portland,
OR: USDA Forest Service; USDI Bureau of Land Management,
Fish and Wildlife Service, and National Park Service. Pp.
427.
- Thomas, J., M. Raphael, R. Anthony, [and others]. 1993.
Viability assessments and management considerations for
species associated with the late-successional and old growth
forests of the Pacific Northwest. The Report of the Scientific
Analysis Team. Prtland, OR: USDA Forest Service Pacific
Northwest Research Station. Pp. 530.
- TSS Consultants. (2002). Prineville, Oregon market area
wood fuel availability assessment. Rancho Cordova, CA. http://www.tssconsultants.com
- Tweedale, J. 2004. Personal communication. Mr.Tweedale
is the Manager of the DNR Marketing Sales, and Leasing
Dept.
- Tweedale, J. 2004. Board of Natural Resources Marketing
and Sales Update. Presentation to the October 5, 2004 Meeting
of the Washington Board of Natural Resources. Olympia,
WA.
- US Environmental Protection Agency. 2001. Smoke, Dust,
and Haze. EPA NW Research Center for Particulate Air Pollution
and Health Newsletter. Summer 2001.
- USDA Forest Service. 2004. Student Career Experience
Program (SCEP). http://www.fs.fed.us/fsjobs/forestservice/scep.html
- USDA Forest Service. 2003. A Strategic Assessment of
Forest Biomass and Fuel Reduction Treatments in Western
States. http://www.fs.fed.us/research/infocenter.html
- USDA Forest Service. 2002. The process predicament:
How statutory, regulatory, and administrative factors affect
national forest management. http://www.fs.fed.us.
- USDE. 2004. Energy Information Administration. http://www.eere.energy.gov/state_energy/mystate.cfm?state=wa
- USDI Bureau of Land Management and USDOE National Renewable
Energy Laboratory. 2003. Assessing the Potential for Renewable
Energy on Public Lands. http://www.nrel.gov
- US Department of Labor. 2005. Inflation Calculator.
Bureau of Labor Statistics. WA. D.C. http://www.bls.gov/cpi/home.htm#data
- Vogt, K., B. Larson, J. Gordon, D. Vogt, and A. Fanzeres.
2000. Forest Certification; Roots, Issues, Challenges,
and Benefits. CRC Press: Boca Raton, London, New York,
WA. D.C. pp.374.
- Vlosky, R. and L. Ozanne. 1998. Environmental Certification
of Wood Products: The U. S. Manufacturers’ Perspective.
Forest Products Journal Vol.48(9).
- Walton, M. 1986. The Deming Management Method. The Putnam
Publishing Group. New York. pp.262
- Wagner, E., E. Hansen, S. Leavengood, J. Punches, and
S. Bowers. 2003. The Big Log Project. Wood Science and
Engineering. Oregon State University. 101 pp.
- Wagner, F., C. Kegan, R. Fight and S. Willits.1998.
Potential for small-diameter sawtimber utilization by the
current sawmill industry in Western North America. Forest
Products Journal. Vol.48(9).
- Warren, D. 2004. Production, Price, Employment, and
Trade in Northwest Forest Industries, All Quarters 2002.
Resource Bulletin. PNW-RB-241. Portland, OR: USDA Forest
Service. Pacific Northwest Research Station.
- Washington Environmental Council. 2004. Conservation
Groups Challenge State Plan to Sharply Boost Logging. Sustainable
State Forests Campaign. http://www.wecprotects.org/forests/10-05-04_lawsuit.cfm
- Washington State Legislature. 2004. Second Substitute
Senate Bill 6144. An Act Relating to opportunities and
strategies for improving forest health in Washington.
http://www.leg.wa.gov/pub/billinfo/2003-04/Senate/6125-6149/6144-s2_sl.pdf
- Washington State Legislature. 2001. WAC 222-12-045 Adaptive
management program. http://www.leg.wa.gov/WAC/index.cfm?section=222-12-045&fuseaction=section
- Western Governors Association. 2001, 2002. Western Governors
Association: A collaborative approach for reducing wildland
fire risks to communities and the environment. 10-Year
Comprehensive Strategy Implementation Plan. http://www.westgov.org/
- Western Wood Products Association (WWPA). 2004. 2003
Statistical Yearbook of the Western Lumber Industry. Portland,
OR.: Western Wood Products Association, Economic Services
Dept. http://www.wwpa.org
- Wilson, J., and C. Oliver. 2000. Stability and density
management in Douglas-fir plantations. Canadian Journal
of Forest Research 30.
- Winterhalter, D. and D. Cassens. 1994. Consumers’ Perceptions
of Forest Sustainability and Willingness-to-pay: Results
of a National Survey. Lafayette, IN: Purdue University
Press.
- Wood Markets Monthly. 2002. Global Lumber Costs & Margins;
Surprising Winners and Losers in 2000. The Monthly International
Solid Wood Report 6(11).
- Youngquist, J., T. Hamilton. 1999. The next century of wood products utilization: a call for reflection and innovation [ICEUPT `99: International Conference on Effective Utilization of Plantation Timber: timber and wood composites for the next century : May 21-23, 1999, Chi-Tou, Taiwan, R.O.C.: proceedings. Chi-Tou, Taiwan: Forest Products Association of R.O.C., 1999?]. http://www.treesearch.fs.fed.us/pubs/viewpub.jsp?index=6006
| APPENDICES (only available in PDF) |
| Appendix A: Survey with Response Data |
| Appendix B: Survey Comments |
| Appendix C: Survey Recipients (this appendix is not available due to privacy for survey participants). |
| Appendix D: Lands and Harvest |
| Appendix E: Harvest Production and Employment |
| Appendix F: WA Sawmills |
| Appendix G: Fire Acres and Expenditures |
| Appendix H: Forest Certification |


