 |
 |
 |
 |


Working Paper 3
Options for Cedar Mill Waste Utilization and Disposal in Western Clallam and Jefferson Counties
Rural Technology Initiative
AcknowledgementsThis report represents a synthesis of information provided from many sources including a review of available literature, pertinent state and federal laws, interviews with individuals, companies, and other organizations. The goal of this investigation, as requested by the Clallam County Economic Development Council, has been to identify environmentally and economically responsible approaches to ensure the viability of the shake and shingle industry in western Clallam County. While the geographical focus of this work has been narrow, it is the belief of the authors that information contained within the following pages will have broader applicability. The project leader and report first author is Larry Mason, Project Coordinator for The Rural Technology Initiative (RTI) at the University of Washington. Members of the research team were John Calhoun, Director of the Olympic Natural Resource Center of the University of Washington, and Bruce Lippke, Professor of Forest Economics at the University of Washington College of Forest Resources and Director of the RTI. This work was made possible by funding provided by the Clallam County Economic Development Council. Active project contributors from the industry and the community that provided input and guidance throughout this investigation included: Tony Romberg (Premium Cedar Co.), John Dematties (Sherico Cedar Products Co.), Jim Haguewood (Clallam Economic Development Council), Rod Fleck (City of Forks), and Bill Hermann (Hermann Logging and Construction Inc.). Of paramount importance for the success of this project was the cooperation received from the many professionals that were contacted within the forest products industry, related industries, and county and city government. No request for information went unanswered. The research team would like to thank Lynne Christensen (Cedar Shake and Shingle Bureau), Gordon McCoy (LP#2 Co.), Charlie Long (Long Cedar Co.), Rob Hart (Long Cedar Co.), Michael Allen (Rejo Cedar Co.), David Haight (Rejo Cedar Co.), Felix Larrechea (Rainy Day Shake Co.), Pancho Leira (ML Cedar Co.), David Hopkins (ML Cedar Co.), Andy Krume (Pacific Cedar Co.), George Powers (Pacific Cedar Co.), Steve Zoffel (Zoffel Log and Mill Co.), Sandy Schier (Silver Moon Accounting Co.), Brent Gagnon (West Waste and Recycling Inc.), Phil Kitchel (Clallam County Economic Development Council - Forest Products Cluster), Edward Tolan (Nippon Paper Industries USA Co. LTD.), Ernie Van Ogle (Kply Inc.), George Cave (Port Townsend Paper Corp.), Bill Quigg (Grays Harbor Paper Co.), Glen Cawley (Grays Harbor Paper Co.), John Pellegrini (Grays Harbor Paper Co.), John McNulty (Local Manufacturing Inc.), Kirk Dalstrom (Viking Lumber Co.), Monte Dalstrom (Dalstrom Lumber Co.), Jim Carlson (Premier Forest Products Inc.), Dean Hurn (Chinook Resources Inc.), Will Possinger (Lincoln Industrial Corporation), Tom Dutcher (EnerWaste International Corp.), Nancy Allison (USDA Natural Resources Conservation Service), and many others. Any opinions, findings, conclusions, or recommendations expressed in this publication are those of the authors and do not necessarily reflect the views of the funding agencies or project cooperators. Due to the short time and limited resources available for this investigation, findings should be considered as preliminary pending further study.
AbstractFor more than 150 years, the manufacture of shingle and shake roofing materials from western red cedar (Thuja plicata) has been an important industry in western Washington. For decades cedar producers have burned waste wood generated from shingle production in wigwam or cyclone burners. The Olympic Region Clean Air Agency (ORCAA) is one of seven regional air pollution control agencies of Washington State. ORCAA enforcement agents have been working with Clallam and Jefferson County cedar mill owners for several years to bring them into compliance with the regulations that prohibit open burning of mill waste (WAC 173-400-050). State air quality regulations designed to reduce industrial emissions of pollutants could result in closure of operations for 11 small cedar mills currently operating in western Clallam and Jefferson Counties unless cost-effective and environmentally-responsible waste disposal solutions are found as alternatives to burning cedar waste in noncompliant outdoor burners. This report, commissioned by the Clallam County Economic Development Council, characterizes the cedar mill industry in western Clallam County and presents information on options for cedar mill waste utilization and disposal that include; burner upgrades, a centrally located incinerator, pellet manufacture, mulch, animal bedding, road bed material, oil and chemical extraction, chips, and hog fuel. Measures of economic feasibility for disposal/utilization alternatives are developed. A list of available funding and loan programs possibly available to assist with needed financing for mill equipment purchases is reviewed. Increasing government interest in wood utilization for biomass-to-energy and heating systems for public buildings is discussed with suggested connection to utilization of cedar waste as part of a broader regional energy strategy and a local economic development opportunity. Keywords: western red cedar, shingles, shakes, burners, air quality, hog fuel, biomass-to-energy, sustainable development.
Executive SummaryBackground Conclusions Ironically, there appear to be broader public costs associated with the potential loss of shingle milling infrastructure that have previously not been considered. Cedar mill closures may mean a lost opportunity to reduce air pollution. Cedar mill waste is an inexpensive biofuel that if used to generate clean electricity would help to reduce state greenhouse gas emissions. Other states have initiated programs, such as Fuels for Schools, to exploit such opportunities to support rural economies while achieving environmental improvements. Increased ability in Forks to utilize wood biomass will support forest management and existing milling infrastructure by creating value for hog fuel. Construction of a biomass-to-energy facility in Forks could also provide new motivation for utilization of old cedar waste piles that pose a potential environmental hazard. Avoided loss of 7 million dollars in tax revenues to local, state, and federal taxing authorities should be considered as a strong economic motivator to invest in hog fuel utilization. Additionally, use of wooden shingles for roofing and siding applications offsets the use of products such as steel, aluminum, and asphalt that are produced from non-renewable resources, are energy-intensive in their manufacture, and subsequently result in comparatively high associated atmospheric emissions.
Recommendations Life cycle analysis of carbon emissions comparisons between wood building products and non-wood alternative products shows that when new forest growth, sequestration in forest and product biomass, displacement of fossil fuel energy, and substitution of non-wood products are considered that wood performs much more favorably than other product alternatives (CORRIM 2005). Olympic Region Clean Air Agency (ORCAA) with other appropriate state agency(s) should initiate a life cycle analysis (LCA) study to fully account for the cradle-grave environmental impacts associated with performance of building product alternatives such as cedar shingles as compared to non-wood roofing and siding products. Especially important, as part of this assessment, should be recommendations on how this proven approach to environmental auditing should be best used to inform achievement of state energy policy goals. The findings presented in this report, while preliminary, suggest that there is unique potential for biomass-to-energy development in Forks as part of the broader state and national energy plan to expand use of renewable resources and reduce greenhouse gas emissions. Representatives from the City of Forks, the Clallam County Economic Development Council, The Clallam Public Utility District, ORCAA, and representatives of other appropriate county, state, and federal agencies as well as other interested parties should review the data and assess the merits of this hypothesis. The authors recommend that a feasibility study should be initiated to more definitively portray the costs, benefits, and potential magnitude of biomass-to-energy development in Forks. Given that July 2005 is very near and that there appears to be a potential for unintended consequences with potentially grievous social, economic, and environmental results, the authors recommend that the existing burners be temporarily granted a release from the July deadline pending the completion of the studies suggested above and any subsequent pursuit of biomass-to-energy development opportunities in Forks. In the interim, however, no expansion of existing burning activities or new construction of burners should be allowed.
|
||||||||||||||||||||||||||||||||||||||||||||||||||||||||||||||||||||||||||||||||||||||||||||||||||||||||||||||||||||||||||||||||||||||||||||||||||||||||||||||||||||||||||||||||||||||||||||||||||||||||||||||||||||||||||||||||||||||||||||||||||||||||||
| Figure 1 | Workers preparing shingle bolts at a Washington mill about 1915. Photographers: Webster & Stevens. From the collection of the Museum of History and Industry. Used with permission. |
| Figure 2 | 1907 shingle mill. Photographer unknown. From the collection of the Everett Public Library. Used with permission. |
| Figure 3 | Shingle saw. 1907. Photographer unknown. From the collection of the Everett Public Library. Used with permission. |
| Figure 4 | Shingle packers in Snohomish County mill. 1910. Photographer unknown. From the collection of the Everett Public Library. Used with permission. |
| Figure 5 | Seaside Shingle Mill. Everett, WA. 1915. Photographer: Juleen. From the collection of the Everett Public Library. Used with permission. |
| Figure 6 | Western Clallam County |
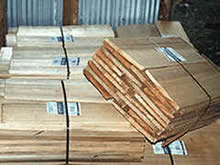
| Figure 7 | Cedar Shakes |
| Figure 8 | Aerial view of Forks, WA. with 4 of the shingle mills in the lower left and the Olympic Natural Resource Center (UW satellite campus) in the lower right. |
| Figure 9 | Shingle mill burners in western Clallam and Jefferson Counties. |
| Figure 10 | Composition of Cedar Mill Residues, 1988 - 2000 (Larson 2000, with Mason estimate) |
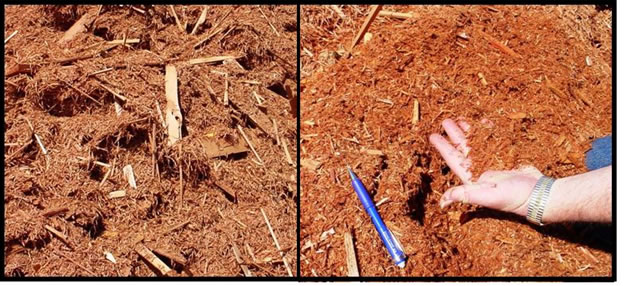
| Figure 11 | Old waste compared to fresh mill waste. Note the lack of bark and chunks in current material on right. |
| Figure 12 | Wood pellets |
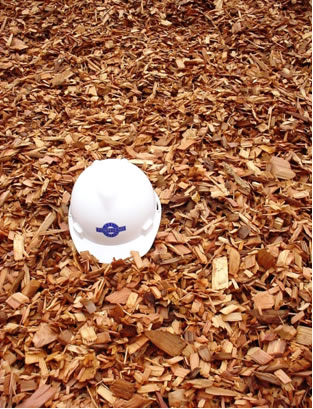
| Figure 13 | Western red cedar chips |
| Figure 14 | Raw Shingle waste on the left compared to hogged shingle waste on the right. |
| Figure 15 | Chip van receiving shingle waste at Premium Mill in Beaver, WA. |
| Figure 16 | Emissions comparisons for wood and non-wood alternatives (from Richter 1998 in IEA 2000) |
| Figure 17 | Automated wood chip conveyor Darby School District. Darby, Montana. Source: Forest Service. |
| Figure 18 | The impact of biomass fuel cost on the cost of energy. Source: McNeil Technologies, Inc. 2003. |
| Figure 19 | Removing bales of forest biomass during forest thinning activity. Source: McNeil Technologies, Inc |
List of Tables
| Table 1 | Estimated Production, Employment, Sales, and Taxes for the Forks Cedar Industry. |
| Table 2 | LBS. of Carbon Emissions Avoided by Burning One Ton of Pellets Verses Alternatives. |
| Table 3 | Heating values for the wood of some NW species in BTU/ovendry ton (Ince 1979). |
| Table 4 | Cedar Waste Test Results (associated with Table 5) |
| Table 5 | Cedar Waste Test Results (associated with Table 4) |
| Table 6 | Comparisons of debt burden for different principles & interest rates for 5 year notes. |
| Table 7 | Comparative fuel costs 2003. |
![]()
Introduction
The Olympic Region Clean Air Agency (ORCAA) is one of seven regional air pollution control agencies located throughout Washington State. ORCAA has regulatory and enforcement authority in and for Clallam, Grays Harbor, Jefferson, Mason, Pacific, and Thurston counties and is responsible for enforcing federal, state and local air pollution standards and governing air pollutant emissions from new and existing sources. The agency operates under the authority of the Clean Air Washington Act (RCW 70.94). A nine member Board of Directors establishes the policies and oversees the operation of the agency. ORCAA enforcement agents have been working with Clallam and Jefferson County cedar mill owners for several years to bring them into compliance with the regulations that prohibit open burning of mill waste (WAC 173-400-050). ORCAA has set a final deadline for compliance on July 1, 2005 after which cedar mill owners/operators may be subject to penalties and other enforcement action if wood waste burning is not stopped or waste burners are modified/replaced to meet federal performance standards. Enforcement of state air quality regulations designed to reduce industrial emissions of pollutants could result in closure of operations for some or all of the 11 small cedar mills currently operating in western Clallam and Jefferson Counties unless cost-effective and environmentally-responsible waste disposal solutions are found as alternatives to burning cedar waste in noncompliant outdoor burners.
In March of 2005, the Clallam County Economic Development Council, in hope of finding acceptable solutions for the disposal of cedar waste that could minimize negative social and economic impacts to the Forks area, while meeting state regulatory goals, asked a team of researchers from the University of Washington to quickly initiate a study to explore and inform them of any viable options. The following report presents study findings based upon best available information that will:
- Characterize the cedar mill industry in Clallam County.
- Document and quantify the problem.
- Identify and characterize systems for processing and handling cedar mill waste.
- Develop operational and economic information about the most promising systems.
- Identify and describe financing opportunities for cedar mills to capitalize required modifications to mill operations.
| C. Larry Mason Project Coordinator Rural Technology Initiative College of Forest Resources University of Washington Seattle, WA 98195-2100 |
John Calhoun Director Olympic Natural Resource Center College of Forest Resources University of Washington Forks, WA 98331 - 9383 |
Bruce Lippke Director Rural Technology Initiative College of Forest Resources University of Washington Seattle, WA 98195-2100 |
![]()
Background
Ralph Andrews (1994) tells us that it all started in the early 1880’s along the Columbia River. At first, there were little hand machines operating along the edges of the wet forests of virgin cedar. The product was thin, light, and strong. It was used on roofs because it would shed rain and snow and last a long time. The product was a cedar shingle and it delivered such good building value that the business of cutting shingles became a major industry in the Pacific Northwest. By the time that the Northern Pacific Railroad arrived on the coast and production machines were introduced, the shingle milling industry was growing fast. In 1893 there were 150 mills manufacturing shingles in Washington. Shingles were shipped overland by rail, and by water freight on schooners bound out of the Columbia River and Puget Sound.
Many mills were powered by water wheels through the early 1900’s. Later the larger mills turned to steam power generated from burning wood waste to run the machinery and dry the product.
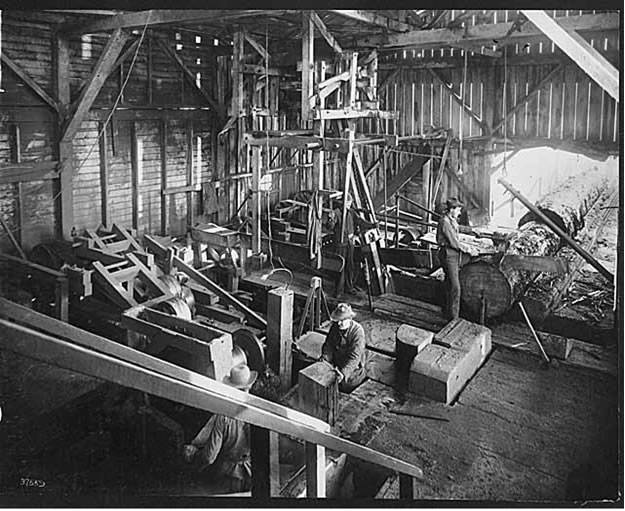 |
| Figure 1. Workers preparing shingle bolts at a Washington mill about 1915. Photographers: Webster & Stevens. From the collection of the Museum of History and Industry. Used with permission. |
In the woods, shingle bolts were cut to 52 inches long from large diameter cedar logs with 20 – 40 bolts to the cord. Bolts were skidded by horse, rafted in booms, and floated down flumes. Cut off saws chopped bolts or logs into 16”, 18” and 24” lengths. Blocks traveled by conveyor to quartering saws that cut across the diameter to give blocks proper size and an opening face of vertical grain from which the sawyer might start the first cut. Additional saws trimmed off bark and surface defects before the prepared shingle blocks traveled to the second floor and the shingle machines. Blocks were placed in machines where saws cut against the face, shifting backward and forward, canting top and bottom. The carriage moved the block past the saw to create a tapered shingle that might have been 3/8” on the butt and 1/16” on the tip. As fresh shingles came from the machine, “knot sawyers” squared edges and trimmed any defects. Grades were segregated by quality and dumped down chutes into bins located on the floor below. Packers assembled bundles, each to contain ¼ of a square or 25 square feet of roof coverage. There was no nonsense. Workers were paid on piece work.
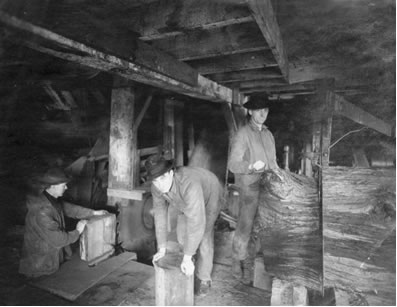 |
| Figure 2. 1907 shingle mill. Photographer unknown. From the collection of the Everett Public Library. Used with permission. |
![]()
Bundles were secured with iron straps and strips of hemlock. Conveyors took the finished bundles to dry kilns where a slow steam process dried the shingles over a period of ten days to two weeks. Waste wood was burned as fuel in huge burners to generate the steam to power the mill, dry the product, and generate electricity. Smoke as a negative consequence of wood burning was not a consideration in this logical and efficient utilization arrangement.
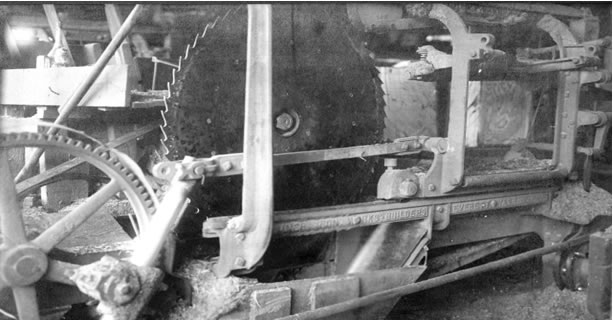 |
| Figure 3. Shingle saw. 1907. Photographer unknown. From the collection of the Everett Public Library. Used with permission. |
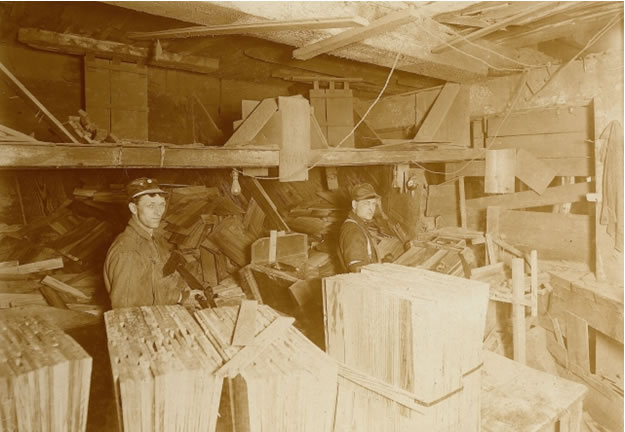 |
| Figure 4. Shingle packers in Snohomish County mill. 1910. Photographer unknown. From the collection of the Everett Public Library. Used with permission. |
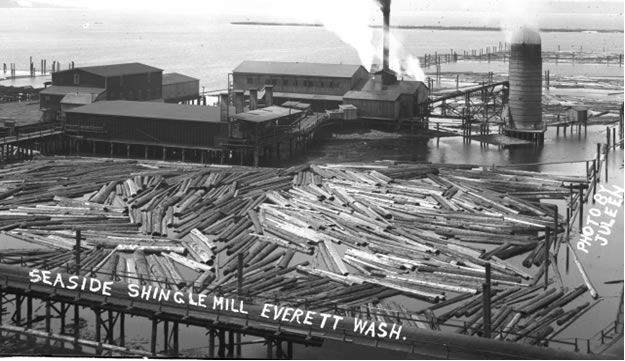 |
| Figure 5. Seaside Shingle Mill. Everett, WA. 1915. Photographer: Juleen. From the collection of the Everett Public Library. Used with permission. |
![]()
During the first half of the twentieth century the mills grew
bigger and bigger. For example, the M.R. Smith Shingle Co. became
a formidable manufacturing organization on the Olympic Peninsula
that owned several mills. Until the early 1970’s, M.R.
Smith Shingle Co. operated the largest steam-powered shingle
mill in the world. It was located on Lake Pleasant in Beaver,
Washington. Logs entered the mill from the lake via the log slip
and were cut into blocks that went to be sawn by ten shingle
machines that operated two shifts. In 1966, the Smith mill at
Beaver produced 132,544 squares of shingles (Maunder and Holman
1975). As reference, a fair-sized home might require 20 square.
There have been many changes for the shingle industry over the
last 100 years. It is a safer industry; a mature industry. It
is a much smaller industry both in overall capacity and size
of manufacturing facilities. Today the combined production of
all operating mills on the northwestern peninsula is substantially
less than that achieved singly by the M.R. Smith Beaver mill
some forty years ago. Most of today’s shingle cedar comes
as 16 to 24 inch long blocks cut from salvage activities that
clean up the leavings of long-previous timber harvesting activities.
The glory has faded but the hard work continues with today’s
shingle “weavers” dedicated more to survival than
to achievement of heady levels of production. Very little cedar
is available any more from public forests. Raw materials must
come almost exclusively from private salvage and are often in
tight supply. To make matters worse, smoke from waste burners
has now become a serious problem that must soon be solved.
No longer is shingle waste burned to generate steam. Electricity does the job instead. Today mill waste, once a resource, has now become a garbage problem. Public concerns over air pollution signal that the time of the unregulated burner is coming to a close. The Olympic Region Clean Air Agency (ORCAA) is a multi-county governmental agency established by Washington State law (Revised Code of Washington (RCW) 70.94) to regulate businesses which emit air pollutants in Thurston, Clallam, Jefferson, Grays Harbor, Mason, and Pacific counties in accordance with the Washington State law WAC (173-400) and ORCAA Regulation 1. For several years ORCAA representatives have been corresponding with shingle mill owners to urge modifications to waste disposal strategies that will bring mills into compliance with state air quality regulations. In July 2005, burners that do not comply with current state air quality regulations appear to be scheduled for enforced shut down. In mid March 2005, the Clallam County Economic Development Council, realizing that no solutions were forthcoming, asked the Rural Technology Initiative (RTI) and the Olympic Natural Resource Center (ONRC) at the University of Washington College of Forest Resources to help inform choices by quickly developing characterizations of alternative strategies for disposal of cedar waste in western Clallam County. An investigation was begun in April 2005.
The Shingle Industry in Western Clallam County 2005
In order to better understand the magnitude of the cedar waste disposal problem, it was determined that a qualified characterization of this local industry should be undertaken by the investigation team. Representatives from the milling companies were interviewed. Reference materials provided by the Cedar Shake & Shingle Bureau, government publications, and from the literature were reviewed to estimate industry production, revenue, employment, and tax contributions.
 Figure 6. Western Clallam County |
Washington Department of Natural Resources (DNR) Mill Survey Reports show a state drop in shake and shingle production of more than 80% between 1986 and 1998 (Larson 2003, 2000, 1998, 1992). In western Clallam County where more than 100 mills operated 20 years ago, 11 mills were found to be in operation today. Mills range in size from one shingle saw to three shingle saws. A tally of all saws in area mills indicates that there are a total of 17 shingle and Figure 6. Western Clallam County 6 shake saws that are available for production. Some mills, however, operate intermittently due to insufficient available cedar raw material needed for shingle manufacture. |
Mills report that direct manufacturing employment can vary between 55 – 63 full time jobs/year. The total estimated employment in contract-support positions such as block cutters, truckers, helicopter operators, pallet makers, accountants, and others is approximately 130 additional jobs. All jobs in the woods, the trucks, and the mills can be considered direct employment. Since there is little automation incorporated into any of these cedar enterprises, it is logical to expect that job multipliers might be higher for this industry sector than for others. With that in mind, employment estimates based upon mill interviews were compared to employment multipliers for the forest products industry that have been developed in the literature. Warren (2004) estimated direct forest industry employment in Washington and Oregon at 13.2 workers/MMBF of annual timber harvest for the year 2002. Han et al. (2002) suggests that, depending upon the availability of paper industry jobs, the number of direct jobs in Idaho may fluctuate from 9 to 11 forest products workers/MMBF of harvest/year. Keegan et al. (2004) found that harvest and processing saw timber generates 9 direct full-time jobs per MMBF per year in Montana. In addition to direct forest industry employment, there are many more indirect jobs that also result from timber harvest that provide benefits throughout the state. Conway (1994) developed a regional interindustry econometric model called the Washington Projection and Simulation Model (WPSM) and estimated the total direct and indirect jobs per year created from one million board foot of timber harvest in Washington State in 1992. Conway found that for every direct industry job/MMBF/year another 4.2 indirect jobs were created. He estimated that for 1992 there were 7.7 direct jobs and 32.3 indirect jobs linked to each MMBF of timber harvest. The Conway WPSM is used here to estimate magnitude of direct and indirect employment. For the 11 shingle mills that make up the cedar industry in the Forks area, the WPSM calculation indicates there should be 121 – 141 direct jobs/year and 509 – 591 indirect jobs/year. While indirect job multipliers require econometric models to estimate employment impacts, a comparison for reasonableness can readily be made for direct job estimates offered by mill owner and estimated direct jobs from WPSM. Total reported direct jobs/year are approximately 185- 193 including all woods and transportation support positions. The WPSM estimate of 121-141 direct jobs/ would appear, as expected given the labor-intensive nature of this industry, to be conservative.
![]()
 Figure
7. Cedar Shakes. Figure
7. Cedar Shakes. |
Assuming an average wholesale price of $100/square of shingles, the combined gross sales value derived from sale of all products produced by the mills of interest would be $10,072,800 - $11,704,800/year. In addition, significant public benefits are derived through the generation of local, state, and federal tax revenues. Local and state tax benefits are calculated at 11% and federal taxes are calculated at 19% of the Gross State Product (GSP) (Lippke et al. 1996). Using $40,000 as a low approximation of the additional state economic activity added to the GSP Figure 7. Cedar Shakes. from each cedar-related job, an estimate of the GSP and associated local, state, and federal tax revenues can be developed from the jobs-to- |
Table 1. Estimated Production, Employment, Sales, and Taxes for the Forks Cedar Industry
Production (cords/year) |
Production (sq/year) |
Gross sales |
Employ (direct) |
Employ (indirect) |
Gross State Product |
State & Local Taxes |
Federal Taxes |
13,121-15,281 |
100,728 - 117,048 |
$10,072,800 - $11,704,800 |
121-141 |
509-591 |
> $24,000,000 |
>$2,640,000 |
>$4,560,000 |
In isolated areas, such as Forks where jobs can be scarce, the social and economic contributions of small businesses leverage higher than for urban counterparts. A University of Washington examination of State urban and rural per capita income from 1979-1997 (CINTRAFOR, 1998) found that increasing urban to rural income disparity in Washington State had reached 66%. Additionally significant to western Clallam and Jefferson Counties is the fact that the shingle industry provides unique employment opportunities for minorities and otherwise marginally employable persons.
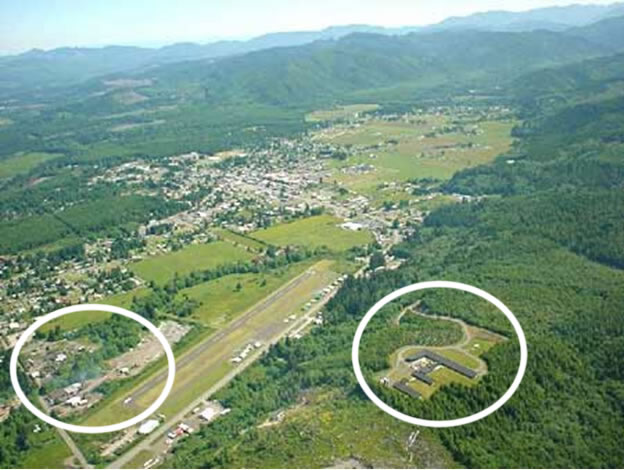 |
| Figure 8. Aerial view of Forks, WA. with 4 of the shingles mills in the lower left and the Olympic Natural Resource Center (UW satellite campus) in the lower right. |
![]()
Financing
Conversion of mill facilities to discontinue burning on site and to accommodate any new combination of processing and transporting will require capital investment. This section of the report will document the results of our research into the options for capitalizing mill conversions.
Commercial Lenders
Several commercial lenders serve western Clallam and Jefferson
County. Various lending products are available. Regional lending
institutions were contacted and asked to provide information
relative to commercial loans suitable for investments in industrial
equipment and modifications that could be needed for cedar
waste system conversions. Bank of America, Sterling Saving
Bank, Frontier Bank and First Federal Savings and Loan provided
data. Borrowers with existing relationships with lenders (business
checking accounts, commercial line of credit, etc.) generally
can obtain more favorable terms then new customers. Commercial
loans are available with terms of from one to five years and
interest rates from 6.5% to 12%. While some lenders surveyed
offer longer amortization of 20 or more years, loans longer
than 5 years would likely outlast the life of the equipment
and therefore be unsuitable for this application. Collateral
for these loans include the underlying real estate. Loan fees
of 1% or more are sometimes required. Loan conditions vary
depending upon credit rating, cash flow, collateral and other
variables.
Evergreen Community Development
The Evergreen Community Development Company is certified and
regulated under the Small Business Administration to make Section
504 loans in the geographic areas of Alaska, Washington, and
parts of Oregon. Section 504 loans are a partnership between
Evergreen Community Development and a local lender providing
funds up to 90% of the total costs for building or equipment
purchase. The purpose of the program is to “expand small
businesses” and “preserve working capital”.
Loans are recommended to be in excess of $200,000 but lower
amounts are also available. Businesses that are required to
purchase equipment because of changing state or federal regulations
automatically qualify for these loans. Funds are made available
for real estate and equipment purchase only; rolling stock
does not qualify for financing under this program. Loans offer
long term repayment schedules of from 10 to 20 years. Interest
rates are fixed for the life of the loan. The rate is negotiated
with the participating bank at market rates. http://www.sba.gov/financing/sbaloan/cdc504.html
The Rural Loan Program, available through Evergreen Community Development is administered in partnership with the US Department of Agriculture and offers loans to businesses in rural communities in amounts from $10,000 to $250,000. Businesses located in rural areas of less then 25,000 people and certain counties in Washington State qualify. Western Clallam and Jefferson county businesses qualify under this program. The program requires 25% down for purchase of equipment and related installation costs but offers long repayment schedules at competitive interest rates.
Both of these programs can be accessed through Evergreen Community Development at 1-800-878-6613 or through their web site http://www.ecda.com.
![]()
Cascadia Revolving Fund
The Cascadia Revolving Fund manages the Olympic Microloan Fund.
The fund provides loans and technical assistance to small businesses
that are unable to obtain financing through conventional sources.
The Counties sponsoring the Olympic Microloan Fund are Clallam,
Grays Harbor, Island, Jefferson, Mason, Pacific, San Juan,
Thurston and Wahkiakum.
Under this program borrowers must have no more then 5 full time employees or equivalent. The income level of the business owners must fall within certain guidelines (relatively low levels). Loan amounts range from $1000 to $25,000, the average fixed rate is 10% and the terms range from 1 to 5 years. Loans can be used for operating costs, purchase of equipment and fixtures, debt refinancing and real estate acquisition.
Cascadia also manages the Forks Revolving Loan Fund. This program is privately funded and designed to offer customized loans to small businesses in the Forks area. The total amount available to loan to all applicants in this revolving loan fund is approximately $25,000. Local administration of this fund is provided by the City of Forks. Rod Fleck or Dan Leinan can be contacted at Forks City hall (360-374-5412).
The Cascadia Olympic Microloan Fund manager is Ruth Ann Halford.
She can be reached at 206-447-9226 ext. 113. Additional information
can be found on the web at
http://www.cascadiafund.org/omf.htm
ShoreBank Enterprise Pacific
The ShoreBank Enterprise Pacific is a private organization that
has been active in Southwest Washington making traditional
and non-traditional loans to rural, resource dependent businesses
and others. They have recently made a commitment to begin lending
activities in the North Olympic Peninsula, particularly Clallam
County. Loan terms and conditions are negotiable but are similar
to programs offered by Cascadia and Evergreen Community Development.
ShoreBank Enterprise Pacific is managed by Mike Dickerson.
He can be reached at 360-642-4265. More information is available
on their web site, http://www.sbpac.com.
Washington State Department of Community, Trade and Economic
Development (CTED)
This state agency administers a number of community development
and business assistance loan and grant programs. Their web site,
www.cted.wa.gov features a “Guided Search for Services,
Grants and Loans.” Our search of this site revealed that
CTED may have direct loan or grant programs for the purposes
for which cedar mills require. Several CTED loan programs are
listed below. Letters of support to other lenders or grant sources
and other non-tangible assistance may be available. The Director’s
office can be reached at 360-725-4000.
![]()
Rural Washington Loan Fund (a CTED program)
The Washington State Rural Washington Loan Fund (RWLF) provides
gap financing to businesses which will create new jobs or retain
existing jobs, particularly for lower-income persons in rural
counties. “Gap” is defined as that portion of a
project which cannot be financed through other sources, but
which is the last portion needed before the overall investment
can occur. Priority is given to timber-dependent and distressed
area projects. Loan amount is determined by the “gap” and
competitive factors, and cannot exceed one-third of the total
project costs. Loans can be secured up to $700,000 with Director's
approval. Funds can be lent for the acquisition, engineering,
improvement, rehabilitation, construction, operation, or maintenance
of any property, real or personal, that is used or is suitable
for use by an economic enterprise. Working capital term loans
are eligible costs. For information contact Steve Saylor at
(360) 725-4046. http://qa.cted.wa.gov/portal/alias__cted/lang__en/tabID__87/DesktopDefault.aspx
Forest Products Revolving Loan Fund Program (a CTED program)
The Forest Products Revolving Loan Fund (RLF) Program is designed
to finance projects which implement value-added production
processes. Financial assistance is available to eligible forest
products firms only in the State of Washington. The RLF program
provides matching loans to qualified small and medium-sized
forest products manufacturing firms to finance projects that
contribute to the diversification of the forest projects industry.
A contract packager works with the applicant to assemble the
application materials including financials, business plans,
and credit analysis. Loan processing of approved applications
is completed by program staff. After closing, loan payments
are made through a contract loan servicer. Loans are available
to meet most financing needs. Typical loans are used to finance
purchase of machinery, equipment and fixtures, real estate,
engineering costs, construction, inventory purchases, and working
capital loans. Loan must be matched 1:1 by non-federal funds.
The minimum loan size is $50,000. The maximum loan size is
$1,000,000. There are a number of fees including a processing
fee, packaging fee, and additional fees may include UCC searches,
real estate title searches, and title insurance. The term of
the loan and the interest rate are negotiable.
The applicant must have sufficient management experience and
technical ability, have a satisfactory credit and personal history
and have a reasonable amount of equity in the business. The business
must show adequate repayment ability and must be willing to pledge
available collateral. Phone Steve Saylor at 360.725.4046
http://qa.cted.wa.gov/portal/alias__cted/lang__en/tabID__91/DesktopDefault.aspx
SBA Loans and Loan Guaranties
When lenders wish to reduce the risk factor in loans to small
businesses, the U.S. Small Business Administration (SBA) programs
offer a way to lower the risk factor to an acceptable level.
The most common SBA loan is the SBA 7(a), or Guaranty Loan.
Under this program, the lender lends its own funds and the
SBA guarantees up to 85 percent of the loan against default.
In addition to reduced risk to the lender, the lender may sell
the 85 percent guaranteed portion of the 7(a) loan on the secondary
market. This makes SBA programs even more attractive to lenders.
All banks are eligible to participate in SBA programs. The
7(a) program is SBA's best means of helping small firms obtain
long-term financing for business needs such as working capital,
machinery, equipment, furniture, fixtures, leasehold improvements,
building acquisition or construction, and in some cases, debt
consolidation. The interest rate on SBA 7(a) loans is usually
a variable rate that floats between 2 percent and 2 3/4 percent
over New York PRIME. The loan term varies depending on the
purpose and collateral. For example, a working capital loan
would carry a maximum term of 7years; a real estate loan could
carry a term of 25 years; and a working capital and real estate
loan could carry a combined term of 15 years. In most cases,
the maximum SBA loan guarantee is $1,000,000.
http://www.sba.gov/financing/sbaloan/7a.html
![]()
Northwest Business Development Association
NWBDA is private lending company managed by a team of finance
professionals that are licensed by the U.S. Small Business
Administration to administer the 504 loan program in the state
of WA and five counties in North Idaho. NWBDA has Business
Development Officers in Spokane, Seattle, Central Washington
and the Vancouver / Southwestern areas to serve small business
needs. A board of directors, composed of experienced community
and business leaders, oversees the company. Phone 425-235-9917
or 425-235-9918. http://www.nwbusiness.org/index.ydev
USDA Business and Industry Guaranteed Loans
The Business and Industry (B&I) Guaranteed Loan Program helps
create jobs and stimulates rural economies by providing financial
backing for rural businesses. This program provides guarantees
up to 90 percent of a loan made by a commercial lender. Loan
proceeds may be used for working capital, machinery and equipment,
buildings and real estate, and certain types of debt refinancing.
The primary purpose is to create and maintain employment and
improve the economic climate in rural communities. This is achieved
by expanding the lending capability of private lenders in rural
areas, helping them make and service quality loans that provide
lasting community benefits. This program represents a true private-
public partnership.
B&I loan guarantees can be extended to loans made by recognized commercial lenders or other authorized lenders in rural areas (this includes all areas other than cities or unincorporated areas of more than 50,000 people and their immediately adjacent urban or urbanizing areas). Generally, recognized lenders include Federal or State chartered banks, credit unions, insurance companies, savings and loan associations, Farm Credit Banks or other Farm Credit System institutions with direct lending authority, a mortgage company that is part of a bank holding company, and the National Rural Utilities Finance Corporation. Other loan sources include eligible Rural Utilities Service electric and telecommunications borrowers and other lenders approved by RBS who have met the designated criteria.
Assistance under the B&I Guaranteed Loan Program is available to virtually any legally organized entity, including a cooperative, corporation, partnership, trust or other profit or nonprofit entity, Indian tribe or Federally recognized tribal group, municipality, county, or other political subdivision of a State.
The maximum aggregate B&I Guaranteed Loan(s) amount that can be offered to any one borrower under this program is $25 million. More information about this program can be obtained from the Natural Resources Conservation Service Rural Development Conservation District in Port Angeles, WA. by calling 360-452-8994 or visiting the national web site at http://www.rurdev.usda.gov/or/gbi.htm .
Small Business Loan Research for a Fee
Several fee-for-service businesses are available to assist small
businesses in finding loan programs or grants. These are not
government programs but private, internet-based businesses
that can help locate loan programs, assist in making applications
and manage processing of loans or grant applications. Fees
are charged depending upon the service rendered. One such service
for fee business is http://www.smallbusinessloans.com. This
business claims, “Our specialty is securing you the lowest
rate and best term with the least documentation required.”
Summary of Selected Loan Programs
Several loan programs have been identified above as designed
to benefit the environment, sustain small businesses, create
or protect jobs in areas affected by declines in the forest
industry, and/or create new forest products related jobs. There
are many programs (private, state, federal, and not-for-profit)
and further research may reveal that this list is not complete.
As a cautionary note to mills considering beginning application
for business financing; loan application processes can be time-consuming,
costly, and often require months to complete. Advice from your
local lender and the Clallam County Economic Development Council
will be well-advised.
![]()
 |
| Figure 9. Shingle mill burners in western Clallam and Jefferson Counties. |
Cedar Waste
The composition of cedar waste generated from shingle manufacture
has changed over time (Larson 2000). Today sawdust and shingle
tow are the dominant portion of mill waste, while the percentage
of bark and chunks has gone to nearly zero. These changes are
largely a result of the industry shift to an almost exclusive
use of salvaged blocks rather than large diameter logs. With
public timber declines in the 1990’s, very few logs were
available for purchase. Blocks are often salvaged by independent
cutters that sling small piles with poly ropes and employ the
services of a helicopter to “fly” the blocks to
a landing for transshipment by truck to the mill. Every effort
is made to trim blocks clean to reduce expense from the woods
to the mill. Figure 10, below, shows how the composition of
cedar mill waste has changed over time from 1988 -2000.
 |
| Figure 10. Composition of Cedar Mill Residues, 1988 – 2000 (Larson 2000, with Mason estimate) |
![]()
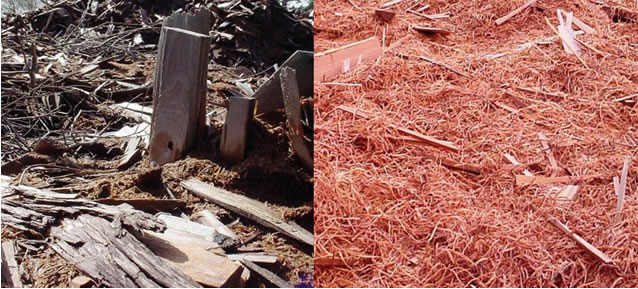 |
| Figure 11. Old waste compared to fresh mill waste. Note the lack of bark and chunks in current material on right. |
Utilization and Disposal Options for Cedar Mill Waste
Burner Upgrades
Several companies fabricate and sell burners that could be
acceptable to meet state air quality standards. Representatives
from Heuristic
Engineering Inc., EnerWaste International Corp. and Lincoln
Industrial Corp., Inc. were contacted and interviewed (Lefcourte,
Possinger,
and Dutchers per com). Burner replacement costs are estimated
to begin around $100,000 with cost magnitude increasing with
capacity need. Burner upgrades (retrofits to existing equipment)
to meet current air quality standards may be possible for mills
with Olivine burners that are in good condition (Dutcher pers
com). Cost estimates for retrofits are problematic and can
only be determined on a case by case basis after inspection
by a qualified
engineer. Many existing burners were locally fabricated and
are unlikely to be suitable as upgrade candidates. A cautionary
note
expressed by professional burner representatives is that there
is no absolute way to know that equipment will pass state air
quality tests prior to investment and installation. While more
thorough study would be helpful to determine the feasibility
of burner upgrades or replacements, based upon preliminary
information, submitted above it, would seem unlikely from
both an engineering
and cost perspective that this option could be pursued by mill
owners.
Centrally Located Incinerator
It has been suggested that financial resources from multiple
mills could be combined to underwrite costs of the establishment
of a centrally located modern burner that would meet regulatory
standards. Operations and maintenance costs would be met through
collection of tipping fees for mill waste deliveries. A feasibility
study would be required to determine if this option is affordable
and realistic. The Energy and Environmental Combustion Laboratory
in the Department of Mechanical Engineering at the University
of Washington (de Brun Kopts and Malte 2004) has conducted
research into wood waste combustion that may be helpful if
further consideration of this option is determined to be warranted.
However, in addition to the caveats mentioned for the previous
option, a centrally located incinerator would add another variable;
unprecedented reliance of one mill upon another. The economic
viability of such a centrally located incinerator, whether
constructed as a cooperative or as entrepreneurial venture,
would always be dependent upon the performance and survival
of the worst operator. No investor(s) has been identified with
interest in developing a for-profit centrally located incinerator.
As well, no enthusiasm for this option was found to be present
among mill owners.
![]()
Pellet fuel is made mainly of sawdust, shavings, and fines that result as a residual byproduct of lumber manufacture. Pellet manufacturers require fine ground wood particles as feedstock. Material is dried, compressed, and extruded into
| small eraser-sized bits. A similar process
is used to manufacture some types of animal food. Pellets
have become a popular heating fuel for residential and commercial
applications. Pellets are highly combustible and produce
little smoke or ash. Some consumers choose pellets as a heating
alternative to reduce consumption of fossil fuels. Table
2 below displays estimates developed by the British Columbia
Pellet Manufacturers Association (BCPMA 2005) for the pounds
of carbon emissions that are avoided when pellets are burned
displacing use of other energy alternatives. BCPMA claims that if every household in the United States converted to wood pellets for heating, the total carbon emissions for the nation would drop by more than 8%. |
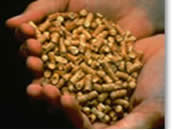
Table 2. LBS. of Carbon Emissions Avoided by Burning One Ton of Pellets Verses Alternatives.
LBS. of Carbon Emissions Avoided by Burning One Ton
of Pellets Verses Alternatives |
|||
Electricity |
Oil |
LPG |
Natural Gas |
3323 |
943 |
709 |
549 |
Pellet manufacture would appear to be a potential long-term and environmentally responsible option for utilizing cedar waste as well as other locally available volumes of hog fuel. Forks would appear to be well-positioned with access to inexpensive residual wood waste. However, a closer look reveals that there may be serious challenges to the feasibility of locating a commercial pellet manufacturing facility in Forks. The only manufacturer of pellets in western Washington is Manke Lumber Co. in Tacoma which produces 30,000 tons of bagged pellet stove fuel each year. Manke is an example of onsite high volume utilization of manufacturing waste to recover value. This situation is dissimilar to the waste problem confronted by cedar mill owners. According to published reports, U. S. market demand for pellets has leveled off in recent years. Future market elasticity to support increased pellet production in western Washington as a cedar waste utilization option can not be assured. Questions of sufficient volume of suitable wood waste available in the Forks area to support profitable pellet manufacture at scales needed to support investment (assuming receptive market) need close examination. Pellets are a low margin and high volume product that must be shipped to distant customers. Transportation isolation may pose a challenge to successful pellet manufacture. The closest railhead to Forks is one hundred miles away in Hoquiam/Aberdeen. The authors are not aware of private investors that currently have interest in pellet manufacture in Forks.
![]()
Mulch
A quick search of the internet found 3 western Washington garden
products companies that offer cedar chips and hog fuel for
sale on a retail basis. All companies are located distant from
Forks in the Puget Sound area. Anecdotal information, however,
suggests that cedar, because of its slow rate of decomposition
and caustic oils, would not be a preferred soil supplement.
Interviews with Washington landscapers were conducted as part
of a prior cedar waste feasibility study in Grays Harbor County
(Cascadia Consulting Group and Re-Sourcing Associates 1999).
Results showed agreement that cedar is a poor soil amendment
and may actually inhibit garden plant growth. This same study,
however, does suggest that there is a market on the east coast
for cedar bark mulch because of its visual appeal to customers.
Western Clallam cedar waste has very little bark. Cedar waste
must be hogged to be offered as mulch. Transportation isolation
of Forks mills would compromise access to distant markets.
While results of this quick study may not be conclusive, the
investigation team located no wholesale market available to
shingle mills for cedar mulch.
Animal Bed Material
Attributes that make cedar desirable for use as animal bedding
include absorption characteristics and appealing natural aroma.
Cedar that is to be used for animal bedding must be chipped
or ground to small piece sizes and is preferred to be dry.
Reports also indicate that cedar may provide pesticidal benefit
by repelling fleas, mites, and other insects. Evidence suggests
that cedar bedding decreases incidences of foot rot in cattle.
However, studies have also shown that cedar if ingested can
have harmful effect on animals and humans that eat them. Fine
slivers present in ground cedar have been known to irritate
live stock (Cascadia Consulting Group and Re-Sourcing Associates
1999). Cedar waste must be ground into hog fuel to make animal
bedding. While results of this quick study may not be conclusive,
the investigation team located no wholesale market available
to shingle mills for animal bedding.
Cedar Oil and Chemicals
Cedar is famous for its rot resistant and aromatic properties.
Extractives can be obtained by hot water extraction and are
readily separated into volatile (1.0 – 1.5% of the heartwood)
and non-volatile fractions (5 – 15%) by steam distillation
(Barton and McDonald 1971). The volatile fraction consists
of thujaplicins, thujic acid, and methyl ester. The thujaplicins
and thujic acid are natural fungicides. The thujaplicins especially
are highly toxic to wood-destroying fungi comparable to the
toxicity of sodium pentachlorophenate. Methyl thujate is one
of the extractives that gives cedar its characteristic odor
(Barton and McDonald 1971). During the 1980’s there was
actually a small company on the western Olympic Peninsula called “Cedar
al” that experimented with cedar oil extraction for purposes
of making an aromatic spray. While this company was able to
successfully extract cedar oil it was unable to remain in business.
More recently, two companies, Forest Pacific Biomass Corp from
Washington and Xylon Biotechnologies Ltd. of British Columbia,
have been to the peninsula to express interest in utilization
of cedar waste for oil and chemical extractions to be used
for fragrances and medicinal applications. There has been no
evidence, however, of investment willingness beyond discussion
but it may not matter for the issue at hand.
Several logistical factors are worthy of note as the suitability of cedar oil extraction is considered relative to the shingle waste problem. It is uncertain whether speculated cedar oil extraction operations would require volumes of waste equal to mill disposal needs. More importantly, however, if cedar oil extraction activities were to be initiated in western Washington, chips would logically be the preferred raw material not mill waste. Chips are uniformly sized for ease of handling and, once the oil is removed, chips can be resold for paper manufacture at the same price at which they were purchased resulting in a zero raw material cost. This would not be the case with shingle waste which would need to be hogged and then sent to a paper mill at a loss. A cedar oil extraction plant would logically be located near a cedar lumber manufacturer that could produce needed chip supplies. It has been more than ten years since there was a cedar saw mill operating in Forks.
![]()
| Cedar chips are a valuable product that can
bring a net revenue return to cedar chip producers. Chips
must be sized during manufacture to meet strict paper company
specif- ications. During the chipping process over-sized and under-sized pieces are removed through screening. This material becomes hog fuel which is a lower value product used for fuel not paper fiber. Port Townsend Paper Corporation requires that 20% of all its chip consumption be cedar. The long fibers, unique to cedar chips, are needed for the manufacture of the kraft pulp and unbleached paper products that are made by this company. Chips must be sized to approximately 7/8 inch long by 3/8 inch thick. Manufacture of chips requires solid wood from chunks or logs. Equipment needed to manufacture chips can be costly; well over $100,000. While some small percentage |
Hog Fuel
During the interview portion of this investigation, potential purchasers of
hog fuel were contacted on the Olympic Peninsula. Purchasers of hog fuel burn
this ground wood material to generate steam and electricity generally to provide
these resources for use in on-site manufacturing processes. The largest purchasers
of hog fuel on the Olympic Peninsula are paper making companies which are able
to mix hog fuel with sludge and liquor residuals from paper manufacture prior
to combustion in boiler systems. Representatives were interviewed from four
companies that purchase hog fuel. Three companies are paper manufacturers and
one produces panel products.
- Nippon Paper Industries USA CO., LTD, Port Angeles, WA. A manufacturer of paper products.
- Kply, Inc., Port Angeles, WA. A manufacturer of plywood products.
- Port Townsend Paper Corporation, Port Townsend, WA. A manufacturer of paper products.
- Grays Harbor Paper Company, Hoquiam, WA. A manufacturer of paper products.
All company hog fuel purchasers expressed concern about the wooly and unmanageable nature of cedar bark. All cedar bark must be removed from hog fuel or it can ball up and clog conveyors. Each company must have hog fuel sized appropriately for efficient transport through hog fuel conveyor systems. Most purchasers report that hog fuel should be ground to meet a 3 inch minus specification. Nippon can take 6 inch minus. Sizing requirements are important to minimize the tendency of wood waste to “bridge” and “rat-hole” in storage bins and at transfer points.
 |
| Figure 14. Raw Shingle waste on the left compared to hogged shingle waste on the right. |
![]()
Fuel value of wood depends on the amount of heat energy that can be recovered. The amount of recoverable heat logically varies with moisture content and chemical composition. Moisture in wood evaporates, absorbs energy in combustion, and escapes in stack gases as heated water vapor. Fuel moisture is usually reported as a percentage of moisture content. Generally green wood can be expected to average around 50% moisture content. However, there can be variation in cedar that can range from below 40% to more than 60% moisture content. In 2000, near Taholah, WA., the Quinault Indian Nation excavated cedar waste from large outdoor stock piles that had accumulated from milling operations decades ago. Approximately 2400 green tons of material were hogged and shipped to Grays Harbor Paper in Hoquiam. The average moisture content for this material was 63% (Conway pers com). A separate study of old cedar waste conducted in Grays Harbor County and found that piles averaged 58% moisture content (Cascadia Consulting Group & Re-Sourcing Associates 1999). It is reasonable to expect that fresh cedar waste from active mill production should have lower moisture content than old piles exposed to years of rain. 50% moisture has been used in this investigation as a ball park estimator for conversion of cedar waste from green tons to dry tons.
Two compositional characteristics of cedar that affect its usefulness as hog fuel are density and oil content. Cedar is relatively less dense than and contains more oil than other species, causing it to burn hot and fast at average moisture content. Western red cedar has been found to have a higher BTU (British thermal unit)/ oven dry lb. (pound) than other Northwest species including Douglas-fir (Pseudotsuga menziesii) and western hemlock (Tsuga heterophylla) (Ince 1979). Some boiler operators suggest that, while cedar may burn too quickly in a 100% concentration, if it is added to a hog fuel mix at about 20% then the burn temperature is raised without speeding the burn, effectively yielding higher overall BTU values (Cascadia Consulting Group & Re-Sourcing Associates 1999).
Table 3. Heating values for the wood of some NW species in BTU/ovendry ton (Ince 1979).Western red cedar |
Douglas-fir |
Western hemlock |
Big leaf maple |
Red alder |
9,700 |
8,950 |
8,370 |
8,400 |
8,860 |
In order to better understand the costs associated with disposal of mill waste as hog fuel rather than combustion in non-compliant burners, information is needed for a number of factors. A waste test was designed and implemented from which data was collected to calculate waste-to-product recovery ratio, the speed at which waste develops during production, the acceptability of cedar waste by existing hog fuel consumers, and the cost of waste shipments. Premium Shingle Company, in Beaver, WA., volunteered the use of its mill for the test program. The existing burner was removed, the existing incline waste conveyer was modified, and a gravel road bed was installed such that a chip van could be located under the conveyor to receive mill waste. The van was stirred and moved as necessary by mill employees to best capture the developing waste from shingle production. To assure collection of undiluted production information, all waste that was collected was limited to the total production of one shingle saw for which daily usage of cedar cord wood and subsequent production of shingles was tallied. West Waste and Recycling, Inc. (WWR) volunteered the use of a live-bottom chip van for the duration of the production test. Periodically the van was hauled to Hermann Brothers Logging and Construction, Inc. (Hermann) chipping and grinding facility in Port Angeles. Hauling was done by WWR truck at a cost of $200 for the 100 mile round trip. At the Hermann yard, vans were unloaded and the cedar waste was ground into hog fuel (approximately 3” minus) for a $2/green ton charge to the cedar mill. Hogged material was shipped to Nippon Paper Industries USA Co., LTD. (Nippon) located at the base of Ediz Hook in Port Angeles. As a result of the test, Nippon has determined that cedar waste is acceptable for use in their boiler system if ground to 6 inch minus and all bark has been removed. Hermann recovers hog fuel payment from the purchaser (Nippon) to underwrite handling costs. Under this arrangement the cedar mill must pay the cost of trucking and the grinding fee. This is currently the only immediately available disposal option to replace waste burners.
![]()
Cedar Waste Test Results |
||||||
| Load # | Date | Days |
Cords |
Net Wt |
Tons/cord |
Tons/day |
| 1 | 4/12/2005 | 7 |
12 |
35,420 |
1.48 |
2.53 |
| 2 | 4/23/2005 | 5.5 |
9.5 |
27,740 |
1.46 |
2.52 |
| 3 | 5/4/2005 | 7.5 |
12.75 |
32,480 |
1.27 |
2.17 |
| 4 | 5/16/2005 | 7.5 |
12.75 |
34,780 |
1.36 |
2.32 |
| Average Four Loads | 6.9 |
11.8 |
32,605 |
1.39 |
2.38 |
|
| Load # | Date |
Truck $/ton |
Hog$/ton |
Waste $/ton |
Waste $/cord |
%Waste $/Gross Sales |
| 1 | 4/12/2005 |
($11.29) |
($2.00) |
($13) |
($20) |
-2.48% |
| 2 | 4/23/2005 |
($14.42) |
($2.00) |
($16) |
($24) |
-3.04% |
| 3 | 5/4/2005 |
($12.32) |
($2.00) |
($14) |
($18) |
-2.31% |
| 4 | 5/16/2005 |
($11.50) |
($2.00) |
($14) |
($18) |
-2.33% |
| Average Four Loads | ($12.27) |
($2.00) |
($14) |
($20) |
-2.54% |
Tables 4 and 5 above display the results of the cedar waste test. When burners are removed and waste is collected in vans for shipment to Port Angeles where the material is hogged to purchaser specifications and then forwarded on to the purchaser, an average additional operations cost of $20/cord must be absorbed by the cedar mill. Expanded to reflect annual impact, this figure calculates to approximately 2.54% of total gross sales representing a total cumulative industry expense of between $154,633 - $279,341/year. Seen as an impact to individual mills, this annual cost would range from a low of $2,469 for the smallest mill with the low production assumption to a high of $73,162 for the largest mill with a high production assumption. These costs do not include the costs of shingle mill modifications to facilitate van loading, the costs of down time during mill modifications, the additional operational costs of extra employees to stir and move the vans, or the possible expense associated with van rental or purchase.
It would be correct to suggest that careful van loading to better maximize payloads should reduce trucking costs. However, van weights when hauled to town during this test were unable to be optimized due to operational challenges in scheduling for the mill and the trucker that are likely to occur under normal business conditions. To effectively maximize haul loads, mills would need to purchase a company truck and two vans such that one van could be collecting waste while the other is delivering to town. It is important to recognize as well that, for this test, no fee was charged for van use. Under more realistic circumstances, mills would need to purchase or rent vans which would increase waste disposal costs. Therefore, it is the conclusion of the investigators that the analysis developed from test data presented above is likely an accurate representation of cost magnitudes that can be expected for this waste disposal alternative.
 |
| Figure 15. Chip van receiving shingle waste at Premium Mill in Beaver, WA. |
Other alternatives were also considered for removing waste for delivery as hog fuel. Simulations were conducted to estimate savings that might result from shipping raw waste to be hogged in Port Angeles in full size possum-belly (as opposed to live bottom) vans that were assumed to be filled to the maximum allowable gross weight for every shipment (30 tons net). Under such optimized circumstances with other test parameters held constant disposal costs could theoretically be reduced to $9/ton or $12/cord.
Another option would be for mills to install on-site hogging capabilities and recover the revenue from direct sales of hog fuel to Port Angeles purchasers. Current price quotes for hog fuel delivered to Port Angeles range from $6 – $16/GT depending upon quality, moisture content, and sales leverage. Western Wood Products Association (2004) reported flat hog fuel prices for the region since 2001 due to increased sawmill production and poor paper prices. The average hog fuel price for western Washington is expected to remain around $22/bone dry ton (BDT) for the foreseeable future. This price would be the equivalent of $11/ GT at 50% moisture content. Allen Logging Company and Portac Inc. are two large capacity sawmilling operations in the Forks area. Both companies produce chips and hog fuel as by-products of lumber production. These mills report that receipts from shipping hog fuel from Forks generally cover trucking costs but produce no net revenue. The cost of installation of hogging capabilities on a per mill basis appears to be somewhere between $30 - $50,000. Rental or purchase of vans and trucks would likely be needed as well, which could add another $30 - $50,000. These estimates assume used equipment purchases and do not include losses from installation down-time or costs associated with the need for additional employees.
An understanding of sales leverage is also important for an accurate evaluation of this alternative or other alternatives where it is assumed that small operations such as the cedar mills are to make individual sales arrangements with large volume hog fuel purchasers. Availability of market supplies/need for hog fuel ebb and flow resulting in times of surplus when the hog fuel purchasers “cut-off” their small volume suppliers. When mills ship waste to a large processing facility such as Hermann there is security that shipments will not likely be stopped when hog fuel is abundant. This would likely not be the case if small mills individually negotiate direct contracts with large paper mills.
A local waste disposal business has expressed interest in the establishment of a privately operated central grinding facility located in the Forks area close to the mills. Waste would be picked up from mills, hogged, and shipped to Port Angeles customers. Mills would be charged a per ton tipping fee. Freight costs plus profit would be captured by the waste company through sale of hog fuel to Port Angeles purchasers. The creation of such new waste disposal infrastructure could, depending upon the magnitude of the tipping fee, create a possibility for reduced waste disposal cost to mill owners. Such an operation would mean that individual mills would not need to purchase and install handling and grinding equipment. The cumulative costs of vans and trucks would also be reduced since duplicate equipment at every mill would not be needed. Capital investment costs for a centrally located facility would likely be several hundred thousand dollars. For example, the Portable tub grinder that Hermann operates (although arguably larger than may be needed for cedar mill waste) has a value of $500,000. Since the total cumulative cedar waste stream with all shingle mills in full operation is estimated to be approximately 3 vans/day, business volume may be inadequate to support a central facility fixed and variable operations costs. The local waste disposal business has placed this alternative under consideration pending the findings of this report.
![]()
A variation of the central facility theme might be to have the cedar mills stock pile waste temporarily pending periodic arrival of privately operated portable grinding equipment. Capital investments could be reduced if a central fixed facility would not be needed. Less investment in vans, dump boxes, or trucks would be needed as well. Waste, after being hogged, could be loaded by front end loader into an arriving van (total van purchases could be reduced to three or four and the need for dump boxes would be eliminated). The waste removal company would work on a contract basis with mills. The potential volume of business would still be a concern and there are other problems with this alternative that must be considered as well; many mills lack needed space and don’t have front end loaders.
Another possible utilization strategy for hog fuel would be for engineered fill applications. Cedar hog fuel has been shown to be useful in road construction projects as a back fill for bank stabilization or where roads must cross bogs or marshes. The WA Department of Transportation, the Washington Department of Natural Resources, and the Forest Service have all successfully used hog fuel for off-highway road building (Cascadia Consulting Group and Re-Sourcing Associates 1999). However, no consistent market for this hog fuel application was found during this investigation. Problems that may limit this use of hog fuel in the future include concerns over spontaneous combustion, decay slumping, and leachate that may be harmful to salmon.
Existing Choices Not Encouraging
A suite of waste disposal alternatives, as was requested by the Clallam County
Economic Development Council, has been presented. None of these options appear
to represent an alternative likely to ensure the viability of the area shingle
mills. Further, financial support for modifications to mills may or may not
be available and is certainly not accessible by July 2005. Table 6 is presented
below to show the sensitivity of debt burden to variations in principle and
interest. The apparent least cost for modest mill modifications would result
in $1000/month payments for 5 years.
Comparisons of debt burden (monthly payment) for 5 year notes |
||
Interest rate |
Principle |
Monthly Payment |
6.50% |
$50,000 |
$978.31 |
6.50% |
$100,000 |
$1,956.62 |
10% |
$50,000 |
$1,062.36 |
10% |
$100,000 |
$2,124.71 |
Results from the Premium Cedar waste test show monthly estimated costs/mill results that distributed to other mills will range from a low of $269 (smallest mill with low production assumption) to a high of $6018 (largest mill with high production assumption). Installation of new hogging or incineration equipment likely would cost each mill a minimum of $1000/month and could be much higher.
![]()
The only immediately available option is to take the raw waste to Port Angeles where the material is hogged and then forwarded on to the purchaser, creating an average additional operations cost of $20/cord that must be absorbed by the cedar mill. Expanded to reflect annual impact, this figure calculates to approximately 2.54% of total gross sales representing a total cumulative industry expense of between $154,633 - $279,341/year. Seen as an impact to individual mills, this annual cost would range from a low of $2,469 for the smallest mill with the low production assumption to a high of $73,162 for the largest mill with a high production assumption. These costs do not include the costs of shingle mill modifications to facilitate van loading, the costs of down time during mill modifications, the additional operational costs of extra employees to stir and move the vans, or the possible expense associated with van rental or purchase.
Whether or not some or all of the mills will be able to absorb the costs associated with options for disposal of waste that have been presented above remains an unknown. However, there are some logical conclusions given the evidence. Mills that can move to better locations closer to Aberdeen where disposal costs are much more affordable may be well advised to do so. Mills that are well capitalized and now are forced to consider the wisdom of the cedar business as compared to other investment alternatives logically may not choose cedar. Mills that are very small marginal operations may have no choice but to close. Mills that do remain will endure waste cost burdens unique to Clallam County that, at the very least, will give comparative advantage to Grays Harbor mills as they compete for scarce raw material. Landowners wishing to sell cedar salvage will loose value in part or entirely as the local industry downsizes and operating costs increase. Marginally employable workers will loose jobs and the local economic/tax contributions of a ten million $ plus local industry will likely be reduced or eliminated. However, the investigation team found that there may be more to this story.
The Case for a Broader View
In addition to social and economic impacts to the Forks community, a potential
loss of shingle milling infrastructure may represent a lost opportunity to
reduce air pollution. We have seen that cedar waste that has been hogged
has real market value. When delivered to Port Angeles the market is $6-16/
GT. The regional average has been shown to be $11/GT. The problem for cedar
mill owners is that current value is less than cost. Handling and freight
charges consume all of the available value and result in substantial disposal
charge. But is this limited-access market price/ton the only measure of hog
fuel worth? We can think about the value of hog fuel another way; to the
hog fuel purchaser the utility value has to be greater than the market price
($11/GT). The utility value of cedar hog fuel can be characterized as having
a price just less than that of the locally available least-cost fuel alternative.
Described simply, this value represents a utility comparison of fuel alternatives
in dollars per unit of energy output which are often measured in British
Thermal Units (Btu). A recent Forest Service study cites an interesting cost/Btu
comparison for alternative fuels based upon 2003 data (Bergman and Zerbe
2004).
![]()
Fuel |
Oil |
Natural Gas |
Coal |
Wood |
$/Million Btu |
$2.25/MM Btu |
$5.60/MM Btu |
$1.27/MM Btu |
$1.20-2.70/MM Btu |
The wood cost used in this table was provided by McNeil Power Station, a 50 megawatt (MW) wood-burning electricity generation station in Burlington, Vermont. The McNeil plant has generated electricity exclusively from wood for more than 20 years. The delivered value of wood fuel represented in the above table was $10 - $23/ green ton. At the high fuel price of $23/green ton, McNeil was producing electricity profitably for the New England market at approximately $0.064/kilowatt hour (kWh).
With growing concerns about global warming, there is an international sense of urgency to reduce consumption of fossil fuels by shifting to clean and renewable energy sources. The 2002 U.N. World Summit on Sustainable Development (Johannesburg Summit) adopted a Political Declaration and a Plan of Implementation, which includes “Clean Energy” as one of its five most important policy directions for the world (World Summit on Sustainable Development 2002). The U.S. State Department followed this directive with its implementation of a $42 million Clean Energy Initiative (U.S. Dept. of State 2002). U.S. domestic energy policy has followed similar direction with legislated incentives and tax credits for renewable energy development (Sissine 2005, Database of State Incentives for Renewable Energy 2005). The State of Washington also provides incentives and premiums for expansion of renewable energy (Database of State Incentives for Renewable Energy 2005). The Clallam Public Utility District, like most energy providers, now offers “green” electricity to those consumers willing to spend a little extra on their power bill to protect the environment. With all of this local-to-global focus on renewable energy, shingle waste (biomass) should be a valuable resource. Biomass-to-energy is the second largest source of renewable clean energy that is produced in Washington. Hydroelectricity is first but, unlike biomass-to-energy, has little potential for expansion.
Morris (1999) in a National Renewable Energy Laboratory Report entitled “The Value of the Benefits of U.S. Biomass Power” calculates the cumulative market and non-market values of biomass power by suggesting estimates of value for many factors normally not considered in hog fuel accounting such as reduced pollution, landfill savings, energy diversity, rural employment, and others. Morris estimates a broader value of biomass power at $0.114/kWh. Morris’ numbers indicate that the utility value of cedar hog fuel is far greater than the per ton price in Port Angeles.
A consortium of national research institutions administered by the University of Washington, The Consortium for Research on Renewable Industrial Materials (CORRIM), has been rigorously studying Life Cycle Analysis for many years. Results show that there are substantial implications for the environment that can be tied to different building product choices. For example, it has been shown that choosing wood building products instead of alternatives such as steel, aluminum, or concrete which are energy-intensive in their manufacture can result in lowered atmospheric emissions of green house gases (CORRIM 2005). These values may not be reflected in the daily price of hog fuel in Port Angeles but have been shown to be significant none-the-less. Additional negative externalities associated with non-wood choices may include water pollution, land fills, and others. A logical question relative to a holistic examination (non-market value accounting) of the pollution factors associated with cedar shingles might be this: If shingle mills go out of business due to waste disposal costs with one consequence being the increased use of asphalt shingles or steel roofing, is the result a net increase or decrease of green house gas emissions? Another related question: If shingle mills are forced out of business because of air quality regulations, has an opportunity for society to access a uniquely affordable biomass fuel supply been sacrificed?
![]()
 |
| Figure 16. Emissions comparisons for wood and non-wood alternatives (from Richter 1998 in IEA 2000) |
The advantages of wood biomass as a source of fuel are generally well known. Wood can be replenished which means that it is sustainable. There is little net production (~5%) of carbon dioxide (CO2), a major green house gas, from wood combustion. Burning fossil fuels releases CO2 that has been locked up for millions of years. Burning wood biomass simply returns to atmosphere the CO2 that was absorbed as the tree grew and is reabsorbed if a cycle of growth and harvest is maintained. Net carbon emissions from generation of a unit of electricity from wood fuel are 10 to 20 times lower than emissions resulting when electricity is generated from fossil fuels (Boman and Turnbull 1997). The report “Greenhouse Gas Emissions Inventory for Washington State, 1990” provides a detailed inventory of greenhouse gas emissions and sinks for Washington in 1990. Emissions were estimated using EPA standardized methodologies. The principal greenhouse gas was carbon dioxide. The major source of carbon dioxide (99%) was fossil fuel combustion (Washington 1992). Wood fuels contain minimal heavy metals and extremely low levels of sulphur (Bergman and Zerbe 2004).
Utilization of Cedar Waste as an Opportunity
If wood fuel is a desirable alternative to fossil fuels, then waste from shingle
mills in the Forks area should represent a low cost opportunity to access
a superior energy product. If cedar hog fuel can be used locally then freight
charges can’t consume the economic value and emissions from diesel
freight to Port Angeles can’t compromise the environmental benefit.
The solution to this problem will not be found in Port Angeles it will be
found in Forks.
The volume of cedar waste produced on a per day basis with all of the shingle mills in operation is estimated to be 76 GT with a low production assumption or 89 GT with a high production assumption. If 240 days (12 months @ 20 days/month) is assumed to be a representative work year, then the total estimated annual production of shingle waste in the Forks area is 18,282 GT (low production) or 21,292 GT (high production). If the average value of hog fuel is $11/GT then this waste stream has approximate gross market value of $201,102 (low) or $234,212 (high). If we add environmental benefits the utility value of this figure leverages higher. If we add the social and economic contribution from this industry, the composite market and non-market value to the community that is embodied in this waste stream becomes very high which should create strong motivation to solve this problem. Yet, due to market/regulatory disconnects, cedar waste material can be had for the taking. Worse, the inability to give this source of energy away appears poised to close the mills. As the rest of this report will attempt to detail, the inquiry sparked by an eleventh-hour problem of what to do about cedar waste will reveal that there are much larger interconnected opportunities to improve both the local air quality and the local economy that have yet to be considered.
![]()
Until recently it took three oil-fired boilers to heat the 118,000 square feet of classrooms, offices, gym, and other
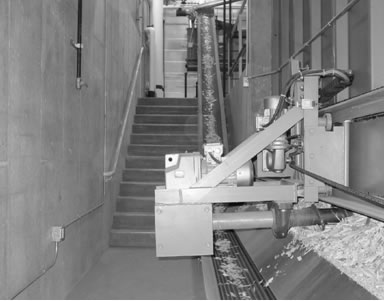 Figure 17. Automated wood chip conveyor Darby School District. Darby, Montana. Source: Forest Service. |
spaces that make up the Darby (Montana) School District. In 2002-2003 school year, the district purchased 52,587gallons of No. 2 fuel oil to fire the three boilers. This is in addition to the large amount of propane needed to supply hot water. This last school year the district purchased only 8,000 gallons of fuel oil. In 2003-2004, the Darby School District, with the help of a Fuels for Schools grant from the Forest Service, put in a wood fired boiler (Fuels for Schools 2005). In addition to heating the buildings, the new system supplies almost all the hot water. In place of 45,000 gallons of fuel oil, the district now burns 600-700 tons of hog fuel. Darby schools have contracted locally to pay $29/GT for delivered wood waste. Total estimated fuel saving the first year of operation is about $57,000 (Stromnes 2004, The Missoulian 2005). |
Other schools all over the country are converting to wood heat with large scale savings. Vermont has been heating many of its schools with wood waste for decades at fuel prices that range from $20 - $34/GT (Maker 2004). Hospitals, commercial buildings, government and other community facilities are also taking advantage of newly available systems for wood heat that require small biomass reserves, have low capital cost requirements, and provide more reliable fuel cost options than price-volatile heating oil or natural gas. Wood boilers to serve institutional needs may range in capacity from as little as 0.3MW to as high as 3MW of thermal energy (equivalent 1 – 10 million Btu/hour) (Energy Efficiency Associates and RDA Engineering 2000). Equipment prices are becoming less and less expensive with complete boiler packages available for $50,000 - $75,000 per million Btu/hr of heat output. A list of installed costs for wood-fired systems is maintained on the Forest Service Forest Products Laboratory web site; http://www.fpl.fs.fed.us/tmu/Wood-Fired_Boiler_sizes_&_Costs.htm (Zerbe and Bergman 2004). Cedar waste could supply the Forks School System with wood for heat at a much lower cost than the literature indicates that other schools are paying. Heating schools with wood has been shown to save money, reduce greenhouse gas emissions, and stimulate the local economy.
Biomass-to-Energy
There have been many research projects and feasibility studies in recent years
that have investigated the potential for biomass utilization of forestry
byproducts to create energy (Sampson et al. 2001, Antares Group Incorporated
2003, R.W. Beck Inc. 2003, McNeil Technologies Inc. 2003 & 2005, Rummer
et al 2003, Perlack et al. 2005). Currently there are more than 500 facilities
around the country that are using wood or wood waste to generate electricity
(Bain and Overend 2002).
The biomass-to-energy industry in the United States has always performed two separate and important functions. It is a waste disposal system and it is an energy production system. This is the same today as it was 100 years ago when cedar mills were burning waste to create steam. Each function has important environmental implications. While energy production from wood generates some level of emissions, when it is considered in a broader context as a substitute for fossil fuel consumption which would otherwise produce much greater levels of emissions, the result is an environmental improvement. Further, the emissions that are produced by wood generally are considered to be carbon neutral as part of a loop of vegetative release and uptake. Carbon is removed from the atmosphere by plants and trees during photosynthesis and sequestered for extended periods of time in growing forests and long term products. Biomass disposal in land fills or open burns can be avoided if biomass-to-energy utilization opportunities are successfully expanded.
![]()
There are a number of means by which biomass can be converted to energy. Wood can used to create steam, methanol, or bio oil. Biomass-to-energy can be exclusively dedicated to heat generation such as the “Fuels for Schools” program discussed above or it can be a combined system that generates steam, hot water, and electricity. The latter is called cogeneration or combined heat and power (CHP) from a single fuel. More heat and power are generated for a lesser amount of fuel by a CHP unit than by single out put units. Research, being conducted to test the feasibility of using wood to create hydrogen for fuel cells, may totally change the relative size and economics of biomass-to-energy. Different utilization strategies will likely be more suitable for some conditions and locations rather than others. While the engineering elements of alternative biomass-to-energy options are beyond the scope of this study, it is important to recognize that current research into biomass-to-energy development will make processes more efficient and subsequently the value of biomass fuel will increase.
A recent Government Accountability Office (GAO) report examined obstacles to broader national biomass-to-energy use and concluded there are two principal obstacles: cost effective utilization and lack of reliable supply (Govt. Acct. Office 2005).
The cedar mills produce 18,282 GT to 21,292 GT per year. This volume would be the equivalent of 3 chip vans/day. This is more than enough to heat the schools as well as most any other city buildings; however, for generating electricity this is a relatively small volume (~ 1 MW). This volume could be augmented with inexpensive hog fuel available from other local manufacturers. There are two major sawmills in the Forks area and several other smaller mills that currently see no return for their hog fuel. The hog fuel is sent to Port Angeles and the payment per ton is barely enough to cover the trucking cost. If these mills could be confident that higher return for their hog fuel could be had in Forks, this additional supply could be available (~8-10 vans/day). Under such circumstances, there could enough biomass from mill waste to generate around 5 MW of electricity per year; which could be enough to provide all the residential electricity needed for Forks.
There appears to be agreement in the literature that if the cost of hog fuel can be kept below $10/GT that biomass-to-energy plants can be economically competitive with fossil fuels depending upon the locally available wholesale price of electricity (McNeil Industries, Inc. 2003).
 |
| Figure 18. The impact of biomass fuel cost on the cost of energy. Source: McNeil Technologies, Inc. 2003. |
Washington has historically enjoyed a very low cost of electricity because of abundant hydro resources. New sources of cheap hydroelectric energy are no longer available. Of all renewable energy options, wood represents the most reliable. The United States has identified increasing renewable energy as an important national priority and is moving to address the failure of the market to mitigate the negative externalities and hidden costs that are associated with fossil fuel reliance. The federal government has responded with the development of policies, price supports, technical assistance and research programs, tax incentives, low interest loans, and other forms of public economic support that are intended to reward investment in biomass-to-energy projects. While many of these programs are national in scope and federally funded, there are also others that may be offered by states, municipalities, public utility districts, carbon credit traders, and non-governmental organizations seeking to promote “green” energy programs. The success of price supports from the Department of Agriculture for the conversion of agricultural corn-to-ethanol provides ample example of how powerfully effective public investment in green energy programs can be (Renewable Fuels Association 2004). The Renewable Electricity Production Tax Credit, renewed in October, 2004 gives an extra $0.009/kWh in tax benefit to producers of biomass energy.
Clean Energy for Forks
Bio-energy infrastructure anchored to inexpensive and reliable hog fuel could
provide new economic opportunities in Western Clallam and Jefferson Counties
that could support removals of biomass from the woods as part of forest management
practices. Forest biomass when added to hog fuel supplies could dramatically
increase energy generation potential.
 |
| Figure 19. Removing bales of forest
biomass during forest thinning activity. Source: McNeil Technologies, Inc. |
![]()
Opportunity for local establishment of biomass-to-energy infrastructure should be considered as the Clallam County Public Utility District (PUD) plans for maintenance, upgrades, and new capacity. Utilizing hog fuel locally has the added benefit of providing new sources of clean electricity with no line loss. The EPA reports that average line losses, that is the electricity lost to resistance as power travels from the generating station to consumer, average 9%. This means that biomass-to-energy that is generated in the rural area where the power is used actually leverages substitution for generated power benefit by an additional 9% while reducing infrastructure needs for transmission lines (U.S. EPA 2005).
Biomass-to-energy infrastructure established in Forks could create viable opportunity to reclaim old cedar waste stock piles with aesthetic and environmental benefit.
More than 50 % of municipal solid waste is wood (lumber and pallets), yard trimmings, and paper. This amounts nearly 2.5 lbs/day/person of material that could be burned as fuel instead of placed in the landfill (U.S. EPA 2003). Paper mills report that ground urban wood waste is the highest quality hog fuel because of its density and low moisture content.
Economic benefits are significant as well. McNeil Industries (2005) in a recently completed study found that the direct employment contribution of a small 3MW cogeneration power plant would include creation of 9 new jobs with a payroll and benefits equal to approximately $436,000/year.
Creation of even a small net return for hog fuel purchased from local manufacturers will have an economic development benefit by creating a more business friendly community. Forest product manufacturers that are already established in business will have new assurance of long term viability. New manufacturing companies may choose Forks instead of other communities where wood waste disposal would be an expense.
Capital investment costs can vary by process and equipment but it is expected that costs are greater than $2,000,000/MW for biomass-to-electricity generating plants. Increasing size of production capacity creates cost efficiencies beyond 20MW. While capital costs for a 5MW plant will likely exceed $10 million, it is important to keep in perspective that another benefit of a biomass-to-energy project located in Forks will be the solution that it creates for the future viability of the cedar industry. A successful cedar industry means retention of more than 600 direct and indirect jobs and a combined (local, state, federal) tax contribution of more than $7million/year.
Perlack et al (2005), in a recently released report prepared by the Oak Ridge National Laboratory for the U.S. Department of Energy entitled, “Biomass as Feedstock for a Bioenergy and Bioproducts Industry: The Technical Feasibility of a Billion-ton Annual Supply”, cautions that residues from primary wood processing mills are very desirable as biomass fuels but are generally committed (> 98%) and unavailable to expand the national green energy program.
Throughout the history of Forks, the cost of transportation has created unique challenges. This time, however, there is an opportunity to turn transportation isolation into a significant public benefit. Hog fuel is uniquely available in Forks while scarce elsewhere. Clean electricity that is generated locally avoids transmission costs and creates economic development benefits.
Loss of the cedar industry in the Forks area would represent loss of an irreplaceable wood utilization infrastructure potentially positioned to make unique contribution to regional energy solutions.
![]()
Conclusions
There is no short term option that is not costly for mills and financial assistance for modification investments does not appear to be immediately available. Results from waste test show monthly estimated costs/mill to range from a low of $269 (smallest mill with low production assumption) to a high of $6018 (largest mill with high production assumption). Installation of new hogging or incineration equipment likely would cost each mill a minimum of $1000/month. Whether or not some or all of the mills will be able to absorb the costs associated with options for disposal of waste that have been investigated in this study remains an unknown. However, there are some logical conclusions given the evidence. Mills that can move to better locations closer to Aberdeen where disposal costs are much more affordable may be well advised to do so. Mills that are well capitalized and now are forced to consider the wisdom of the cedar business verses other investment alternatives logically may not choose cedar. Mills that are very small marginal operations may have no choice but to close. Mills that do remain will endure waste cost burdens unique to western Clallam and Jefferson County that, at the very least, will give comparative advantage to Grays Harbor mills as they compete for scarce raw material. Landowners wishing to sell cedar salvage will loose value in part or entirely as the local industry downsizes and operating costs increase. Marginally employable workers will loose jobs and the local economic/tax contributions of a ten million dollar local industry will be reduced.
Ironically, there appear to be broader public costs associated with the potential loss of shingle milling infrastructure that have previously not been considered. Cedar mill closures may mean a lost opportunity to reduce air pollution. Cedar mill waste is an inexpensive biofuel that if used to generate clean electricity would help to reduce state greenhouse gas emissions. Other states have initiated programs, such as Fuels for Schools, to exploit such opportunities to support rural economies while achieving environmental improvements. Increased ability in Forks to utilize wood biomass will support forest management and existing milling infrastructure by creating value for hog fuel. Construction of a biomass-to-energy facility in Forks could also provide new motivation for utilization of old cedar waste piles that pose a potential environmental hazard (Cascadia Group and Re-Sourcing Associates 1999). Avoided loss of 7 million dollars in tax revenues to local, state, and federal taxing authorities should be considered as a strong economic motivator to invest in hog fuel utilization. Additionally, use of wooden shingles for roofing and siding applications offsets the use of products such as steel, aluminum, and asphalt that are produced from non-renewable resources, are energy-intensive in their manufacture, and subsequently result in comparatively high associated atmospheric emissions (CORRIM 2004).
![]()
Recommendations
- The shake and shingle industry represents an important industry
in western Clallam and Jefferson Counties that contributes substantial
economic and social benefits. It appears that opportunities exist
for the cedar industry to contribute mill residuals to cost-effective
biomass-to-energy projects with recognizable environmental benefits.
Enforcement of burner shut downs will likely impose more than minor
costs on shingle businesses. Olympic Region Clean Air Agency (ORCAA)
should prepare a small business economic impact statement to fully
assess the impacts of compliance with the regulations that prohibit
open burning of mill waste (WAC 173-400-050) to the cedar businesses.
- Life cycle analysis of carbon emissions comparisons between wood
building products and non-wood alternative products shows that
when new forest growth, sequestration in forest and product biomass,
displacement of fossil fuel energy, and substitution of non- wood
products are considered that wood performs much more favorably
than other product alternatives (CORRIM 2005). Olympic Region Clean
Air Agency (ORCAA) with other appropriate state agency(s) should
initiate a life cycle analysis (LCA) study to fully account for
the cradle-grave environmental impacts associated with performance
of building product alternatives such as cedar shingles as compared
to non-wood roofing and siding products. Especially important,
as part of this assessment, should be recommendations on how this
proven approach to environmental auditing should be best used to
inform achievement of state energy policy goals.
- The findings presented in this report, while preliminary, suggest
that there is unique potential for biomass-to-energy development
in Forks as part of the broader state and national energy plan
to expand use of renewable resources and reduce greenhouse gas
emissions. Representatives from the City of Forks, the Clallam
County Economic Development Council, The Clallam Public Utility
District, ORCAA, and representatives of other appropriate county,
state, and federal agencies as well as other interested parties
should assess the merits of this hypothesis. The authors recommend
that a feasibility study should be initiated to more definitively
portray the costs, benefits, and potential magnitude of biomass-to-energy
development in Forks.
- Given that July 2005 is very near and that there appears to be
a potential for unintended consequences with potentially grievous
social, economic, and environmental results, the authors recommend
that the existing burners be temporarily granted a release from
the July deadline pending the completion of the studies suggested
above and any subsequent pursuit of biomass-to-energy development
opportunities in Forks. In the interim, however, no expansion of
existing burning activities or new construction of new burners
should be allowed.

References
- Andrews, R. 1994. This Was Sawmilling. Sawdust Sagas of the Western
Mills. Schiffer Publishing Co. Atglen, PA. pp. 176
- Antares Group Inc. 2003. Assessment of Power Production at Rural
Utilities Using Forest Thinnings and Commercially Available Biomass
Power Technologies. USDA, USDOE, NREL. Landover, MD.
- Bain R. and R. Overend. 2002. Biomass for heat and power. Forest
Products Journal. Vol.52,Is2.
- Barton, G. and B. MacDonald. 1971. The chemistry and utilization
of western red cedar. Publ. No. 1023. Vancouver, B.C. Can. For.
Serv., Dept. Fish. And For., For. Prod. Lab.
- Bergman, R. and J. Zerbe. 2004. Primer on Wood Biomass for Energy.
Tech. Paper. Madison, WI. USDA For. Serv. State and Pri. For. Tech.
Marketing Unit and For. Prod. Lab.
http://www.fpl.fs.fed.us/tmu/pdf/primer_on_wood_biomass_for_energy.pdf
- Boman, U. and J. Turnbull. 1997. Integrated biomass energy systems
and emissions of carbon dioxide. Biomass and Bioenergy, 13.
- Briggs, D. 1994. Forest Products Measurements and Conversion
Factors: With Special Emphasis on the U.S. Pacific Northwest. Institute
of Forest Resources Contribution No. 75. College of Forest Resources.
University of Washington. Seattle, WA. pp.161.
- BCPFMA. 2005. British Columbia Pellet Fuel Manufacturers Assoc. http://www.pellet.org/about.html
- Cascadia Consulting Group and Re-Sourcing Associates. 1999.
Cedar Waste Venture Feasibility Study. Prepared for Columbia-Pacific
Resource Conservation & Economic Development District. Aberdeen,
WA.
- CINTRAFOR. 1998. Disparity in Timber Rural vs. Urban Income
in Washington State Rising. Center for Int. Trade in For. Prod.
Fact Sheet #36. College of Forest Resources. University of Washington.
Seattle, WA.
- Conway, B. pers. con. Quinault Indian Nation.
- Conway R. 1994. The Forest Products Economic Impact Study Current
Conditions and Issues. Prepared for Washington Forest Protection
Association, Washington Department of Natural Resources, and Washington
Department of Trade and Economic Development. Olympia, WA.
- CORRIM. 2005. http://www.corrim.org/reports/
- CORRIM. 2005. Assessing Environmental Quality of Residual Construction
using LCI & LCA: the role of processes, products, and design.
RTI streaming video http://www.corrim.org/ppt/phase1/video/Default.htm#nopreload=1&autostart=0
- Database of State Incentives for Renewable Energy. 2005. http://www.dsireusa.org
- De Bruyn Kops, S. and P. Malte. 2004. Simulation and Modeling
of Wood Dust Combustion in Cyclone Burners. Final Technical Report.
U.S. Dept of Energy.
http://faculty.washington.edu/malte/pubs/final_report_wood_dust_combustion_in_cyclone_burners.pdf
- Dutcher, T. pers. com. EnerWaste Inc.
- Energy Efficiency Associates and RDA Engineering. 2000. Final
Feasibility Study: Central Wood heating System for Belchertown
Schools. Calais, VT.
http://www.nrbp.org/pdfs/pub22.pdf
- Everett Public Library. http://www.epls.org/nw/digital_collections.htm
- Fuels for Schools Program. http://www.fuelsforschools.org/
- Gov. Acct. Office. 2005. Federal Agencies Are Engaged in Various
Efforts to Promote the Utilization of Woody Biomass, but Significant
Obstacles to its Use Remain. Report to Congress. http://www.gao.gov/new.items/do5373.pdf
- Han, H., H. Lee, L. Johnson, R. Folk, T. Gorman, J. Hinson,
and G. Jackson. 2002. Economic feasibility of small wood harvesting
and utilization on the Boise National Forest: Cascade, Idaho City,
Emmett Ranger Districts. Department of Forest Products, College
of Natural Resources, University of Idaho. Moscow, ID.
- IEA (International Energy Agency) 2000. Answers to ten frequently
asked questions about bioenergy, carbon sinks, and their role in
global climate change. IEA Bioenergy Task 38. Graz, Austria.
http://www.joanneum.ac.at/iea-bioenergy-task38/publications/faq/task38faq.pdf
- Ince, P. 1979. How to Estimate Recoverable Heat Energy in Wood
or Bark Fuels. Gen. Tech. Rep. FPL 29. Madison, WI. USDA For. Serv.
For. Prod. Lab.
- Keegan III, C., C. Fiedler and T. Morgan. 2004. Wildfire in
Montana: Potential hazard reduction and economic effects of a strategic
treatment program. Forest Products Journal. 54(7/8).
- Larson, D. 2003, 2000, 1998, 1992. Washington Mill Surveys for
1998, 1996, 19992, 1988. Washington DNR. Olympia, WA. http://www.dnr.gov
- Lefcort, M. pers com. Heuristic Engineering Inc.
- Lippke, B., J. Sessions, and A. Carey. 1996. Economic Analysis
of Forest Landscape Management Alternatives. CINTRAFOR Special
Paper 21. University of Washington College of Forest Resources.
Seattle, WA. http://www.cintrafor.org
- Maker, T. 2004 (Revised). Wood-Chip Heating Systems; A Guide
for Institutional and Commercial Biomass Utilizations. Biomass
Energy Resource Center. Montpelier, VT.
http://www.biomasscenter.org/pdfs/Wood-Chip-Heating-Guide.pdf
- Maunder, E. and B. Holman. 1975. Paul R. Smith views the western
red cedar industry, 1910 to the present. Forest History Society.
Santa Cruz, CA. pp.106.
- McNeil Generating Station, Burlington, VT. 2005. Operations
Report
http://www.westbioenergy.org/lessons/les04.htm
- McNeil Technologies, Inc. 2003. Biomass Resource Assessment
and Utilization Options for Three Counties in Eastern Oregon. Lakewood,
CO.
http://www.energy.state.or.us/biomass/document/EOBRA/FullText.pdf
- McNeil Technologies, Inc. 2005. Jefferson County Biomass Facility
Feasibility Study. Lakewood, CO.
http://www.state.co.us/oemc/biomass/reports/Jeffco%20Biomass%20Final%20Report_01-21-05.pdf
- The Missoulian. 2005. Thar’s Btus in them thar hills.
The Missoulian.
http://missoulian.com/articles/2005/01/19/opimion/opimion2.txt
- Museum of History and Industry. http://www.seattlehistory.org/col_res.cfm
- Perlack, R., L. Wright, A. Turhollow, R. Graham, B. Stokes,
and D. Erbach. 2005. Biomass as Feedstock for a Bioenergy and Bioproducts
Industry: The Technical Feasibility of a Billion-Ton Annual Supply.
U.S. Department of Energy. Oak Ridge National Laboratory. Oak Ridge,
TN.
- Possinger, W. pers com. Lincoln Industrial Corporation, Inc.
- Renewable Fuels Association. 2004. Ethanol and Agriculture. http://www.ethanolrfa.org/factfic_ag.html
- R.W. Beck, Inc. 2003. Review of Biomass Fuels and Technologies;
Yakima County Public Works Solid Waste Division.
- Richter, K. (1998). Life Cycle Assessment of Wood Products.
In: Kohlmeier, G., M. Weber, and R. Houghton, eds. Carbon Dioxide
mitigation in forestry and wood industry. Heidelberg: Springer-Verlag,
p. 219-248.
- Rummer, B. et al. (2003). A Strategic Assessment of Forest Biomass
and Fuel Reduction Treatments in Western States. USDA Forest Service.
Research and Development.
http://www.fs.fed.us/research/infocenter.html
- Sampson, R.N., M. Smith, and S. Gann. 2001. Western Forest health
and Biomass Energy Potential. A Report to the Oregon Office of
Energy. The Sampson Group Inc. Alexandria. VA.
- Sissine, F. 2005. Renewable Energy: Tax, Credit, Budget, and
Electricity Production Issues. Congressional Research Service Issue
Brief for Congress.
http://www.eesi.org/briefings/2005/Climate%20&%20Energy/4.15.05%20RE%20Budget/Sissine%20Issue%20Brief%204.15.05.pdf
- Spelter, H. 2002. Conversion of board foot scaled logs to cubic
meters in Washington State. 1970-1998. Gen. Tech. Rep. FPL-GTR-131.
Madison, WI: USDA Forest Service. Forest Products Laboratory.
- Stromnes, J. 2004. Thompson Falls Schools eye biomass heating
system. The Missoulian.
http://missoulian.com/articles/2004/03/09/news/mtregional/news06.txt
- U.S. Dept. of State. 2002. Clean Energy Initiative. Bureau of
Oceans and International Environmental and Scientific Affairs.
WA. D.C. http://www.state.gov/g/oes/sus/wssd/
- U.S. EPA. 2003. Municipal Solid Waste Generation, Recycling,
and Disposal in the United States: Facts and Figures for 2003. http://www.epa.gov/epaoswer/non-hw/muncpl/msw.99.htm
- U.S. EPA. 2005. What Air Emissions Are Caused by the Electricity
I Use?
http://oaspub.epa.gov/powpro/ept_pack.router
- U.S. GAO. 2005. Federal Agencies are Engaged in Various Efforts
to Promote the Utilization of Woody Biomass, but Significant Obstacles
to Its Use Remain. Govt. Acct. Office. WA. D.C.
http://www.gao.gov/new.items/d05373.pdf
- Warren, D. 2004. Production, Price, Employment, and trade in
Northwest Forest Industries, All Quarters 2002. Resource Bulletin.
PNW-RB-241. Portland, OR: USDA Forest Service. Pacific Northwest
Research Station.
- Washington. 1992. Washington Greenhouse Gas Emissions and Sinks
Inventory Summary.
http://yosemite.epa.gov/oar/golbalwarming.nsf/UniqueKeyLoop/JSIN5DQT79/$file?WASummary.PDF
- Western Wood Products Association (WWPA). 2004. 2003 Statistical
Yearbook of the Western Lumber Industry. Portland, OR.: Western
Woods Products Association, Economic Services Dept. www.wwpa.org
- World Summit on Sustainable Development. 2002. http://www.johnnesburgsummit.org/
- Zerbe, J. and R. Bergman. 2004. Basic Wood Energy Information.
Tech. Paper. Madison, WI. USDA For. Serv. State and Pri. For. Tech.
Marketing Unit and For. Prod. Lab.
http://www.fpl.fs.fed.us/tmu/pdf/basic_wood_energy_information.pdf
![]()

