 |
 |
 |
 |


Developing Stand Density Thresholds to address Mountain Pine Beetle Susceptibility in Eastern Washington Forests
|
Elaine E. Oneil
A dissertation submitted in partial fulfillment of the
Doctor of Philosophy University of Washington 2006 Program Authorized to Offer Degree: College of Forest Resources
Abstract Developing Stand Density Thresholds to address Mountain Pine Beetle
Elaine E. Oneil
Chair of the Supervisory Committee:
This study examines the insect/host relationship between the Mountain Pine Beetle (MPB) (Dendroctonus ponderosae) and one of its major hosts, lodgepole pine (Pinus contorta) to discern how carrying capacity and climate influence this disturbance in eastern Washington forests. The research specifically focuses on host susceptibility as a function of site, stand, and climate variables. The study finds that incorporating site carrying capacity as a predictor of lodgepole pine susceptibility to MPB attack improves our ability to estimate impacts. However, that even with the inclusion of a site carrying capacity variable, only 19.8-24.2% of the deviance in MPB attack is directly attributable to site and stand attributes. The remaining explainable deviance is attributable to climate parameters. Historically accurate predictors of MPB susceptibility such as basal area and stand density are no longer significant predictors of MPB attack after the year 2000. Carrying capacity is a significant predictor even during times of drought. Thinning to a basal area target that does not consider carrying capacity would not reduce susceptibility to MPB attack under current climate conditions. Research on MPB epidemics elsewhere found that the impact of climate change is a result of improved MPB winter survival, but these results find that summer temperature and its impact on average Vapor Pressure Deficit is the primary driver of host susceptibility to MPB in eastern Washington. While pre-growing season moisture is a contributing factor in MPB attack, drought is not as significant a variable as the shift in temperature. Changes in average summer VPD appear to have reached a threshold which is fundamentally altering tree susceptibility to MPB populations. While increasing insect activity is certainly implicated in the dramatic increase in MPB levels in the recent past, the role of increasing host susceptibility because of climate change can no longer be ignored.
Table of ContentsClick here to open the PDF version (2MB)
List of Figures
|
| Table1.2: | GBA predictors |
| Table 1.3: | Location and number of CVS plots with MPB attacks |
| Table 1.4: | Best fit models of stocking, stand, and site variables |
| Table 2.1: | Site and stand variables for each plot |
| Table 2.2: | Climate Factors generated from DAYMET daily point data |
| Table 2.3: | Distribution of climate x MPB attack by year for all National Forests |
| Table 2.4: | Distribution of climate x MPB attack on the Colville and Okanogan National Forests only |
| Table 2.5: | Count data on MPB attacks by time period |
| Table 2.6: | Distribution of attacks by elevation across all years |
| Table 2.7: | Significant predictors for the GLM-B model |
| Table 2.8: | Predictors for the non-zero component of the ZINB model |
| Table 2.9: | Significant predictors for GLM-P model |
| Table 2.10: | Significant predictors for the non-zero component of the ZIP model |
Acknowledgements
The author wishes to acknowledge the Rural Technology Initiative at the University of Washington, College of Forest Resources, for its financial support while pursuing this course of study. I greatly appreciated the direction from my Chair, Professor R.I. Gara, especially in directing me toward vapor pressure deficit as a key predictor of Mountain Pine Beetle attack. Professor D. McKenzie deserves a special thanks for his help in structuring the statistical analyses and ensuring that I understood how to use generalized linear models. I am most grateful to Professor Bruce Lippke for his constant encouragement and support in giving me the freedom to pursue a direction until it bore fruit, and for his role in ensuring that my ideas were presented in the broader scientific community. Professor D. Briggs deserves my thanks for challenging me to understand models, and for providing advice on dealing with carrying capacity. Professor R. Rosenblatt’s interest in the subject matter, as well as in the process used to investigate it, was a great inspiration and encouragement to me.
Professor T. Hinckley’s helpful ideas on how to capture changes in carrying capacity and its implications for tree physiology, were much appreciated. I greatly appreciate the advice on using zero-inflated distributions from Indroneil Ganguly. Dr. J. McCarter, K. Ceder, L. Rogers, H. Imaki, L. Mason, M. McLaughlin, and C. Burnett gave me invaluable technical support. Thank you to the RTI staff for their ongoing friendship, critiques, and assistance. Dr. M. Ledwith gave much wise counsel and editing assistance, and encouraged me when it was needed most. Thank you to all of my family and friends who have supported me in countless ways over the many years of study, and especially for their support in the final stages of the work.
Introduction
Eastern Washington forests are increasingly impacted by insect outbreaks and in recent years, large outbreaks of the Mountain Pine Beetle (Dendroctonus ponderosae Hopkins) (MPB) have occurred in both managed and unmanaged forests throughout the region. The MPB is a very aggressive bark beetle, and some management organizations (http://www.fs.fed.us/r2/fhm/bugcrud/silvmpb.htm) consider it the most aggressive bark beetle in the western USA. The MPB requires living hosts, and must overcome their defenses in order to successfully reproduce, whereas many other species in the genera prefer trees that have recently died. The MPB attacks all native pines in western North America. It has gained some notoriety in recent years because of the vast expanses of MPB killed lodgepole pine forests in central British Columbia, Canada, which is the largest epidemic of the tree killing beetle ever recorded.
Although the impacts in Eastern Washington are not as large as those in central British Columbia (www.for.gov.bc.ca/hfp/mountain_pine_beetle), recent mortality trends have generated significant concern. According to the 2005 Washington State Department of Natural Resources aerial survey, MPB attacks in 2004 covered almost 554,000 acres of eastern Washington forests. The outbreaks have been predominantly in lodgepole and ponderosa pine forests, with an increasing number of MPB attacks occurring in high elevation pine species since 2000. The affected acreage in Washington has increased substantially in recent times, with a 100,000 acre increase from 2003 to 2004 and a 124,000 acre increase from 2004 to 2005 surveys. Likewise, the number of trees per acre that are killed has increased substantially in the recent past, with an average of 2.2 TPA for 1980-1999, compared to an 8.4 TPA average from 2000 onward. The MPB contributed 19% of the overall eastern Washington mortality in 2003. In 2004, MPB attacks were responsible for approximately 54% of the mortality statewide. This suggests that either the MPB population, or the trees’ ability to respond, has crossed some threshold that we have yet to define. (Numbers derived from data on the Washington State Department of Natural Resources and United States Forest Service Forest Health protection websites at: www.dnr.wa.gov/htdocs/rp/forhealth/2005highlights and www.fs.fed.us/r6/nr/fid/data.shtml respectively).
An increasing number of acres are affected by the insect, though not all trees have been killed on every acre. This variation in mortality rates suggest that although MPB react to the density of given stands, not all stands are equally affected at a given tree density or basal area (BA). Determining when stands become susceptible and why there is such variability is central to devising appropriate strategies for mitigating MPB mortality. In the past, thinning to reduce tree stress and competition for available resources was successful in reducing MPB attacks. Applying a thinning strategy to address MPB impacts in this era of elevated mortality needs to consider the following questions: How much do we thin? What site specific criteria should drive our thinning operations? What constraints may apply in addressing current or future risks associated with shifting climate trends? These questions suggest that an approach that integrates site and stand attributes with climatic conditions is needed to ensure long term ecosystem integrity and sustainability. Estimating acceptable stocking levels for various sites is the first step in determining a successful approach to the timing and amount of thinning needed to achieve goals at both the stand and landscape level. This approach would provide a valuable contribution to MPB management in eastern Washington.
In order to determine how stand conditions influence MPB attack levels on specific sites, it is necessary to establish the links between carrying capacity, climate, and stand parameters such as density and BA. The relationship between climate, stand carrying capacity, and stand metrics, are analogous to the familiar elements of the fire risk triangle (Figure I.1). In fire management it is recognized that only the fuel leg of the triangle can be managed, but the other 2 legs are integral in estimations of risk and impacts during a fire event. The key elements of the mountain pine beetle susceptibility triangle are stand parameters, stand carrying capacity, and weather/climate variables. Although stand parameters such as basal area, stand density index, or leaf area index, are used to measure stand carrying capacity, the carrying capacity leg of the triangle reflects the inherent productive capacity of the soil moisture and nutrient matrix. The role of site carrying capacity in bark beetle infestation is analogous to the topography leg of the fire effects triangle (Figure I.1). As with topographic limitations during a fire event, management does not generally change site carrying capacity, but by understanding the limitations imposed by carrying capacity, weather, and climate during a ‘mountain pine beetle event’, more accurate prediction and mitigation can ensue.
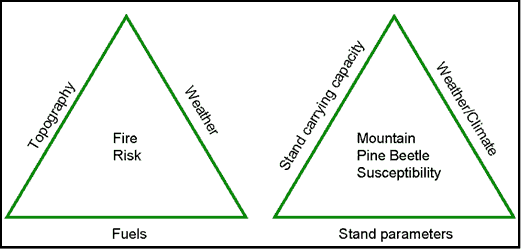 |
Figure I.1: Common elements in fire risk and mountain pine beetle susceptibility rating |
The MPB susceptibility triangle as a conceptual model explicitly identifies carrying capacity, stand, and climate variables as key elements in determining the outcome of a mountain pine beetle attack. This model does not address the reasons for an attack any more than the fire triangle addresses the reasons for a fire; the model is focused specifically on host susceptibility rather than MPB population dynamics. Shore et al. (1992) use the terms susceptibility, risk, and hazard, to differentiate between the variables used in determining the likelihood of attack. Using Shore et al.’s terminology, “susceptibility” indices quantify stand and tree characteristics; “risk” indices quantify presence and abundance of bark beetles, called ‘beetle pressure’; and the combination of the two indices identifies “hazard”. My study focuses specifically on the condition of the host as it is affected by carrying capacity and climate. Using Shore’s terminology then, MPB susceptibility as a function of site and climate variables will be determined, leaving aside questions of risk and hazard.
Field studies on MPB attack in both lodgepole and ponderosa pine report a range of susceptibility ‘thresholds’ that are measured by a wide variety of stand parameters including age, stand density, relative density, basal area, and vigor indices such as grams of wood produced per unit leaf area. To assess how susceptibility thresholds might be related to site quality, selected studies that identified a basal area threshold below which MPB do not generally attack were compared to simulated growth trajectories for ponderosa pine across a range of habitat types and site qualities (Figure 1.2). The studies reported a range of basal area thresholds from 78 ft 2/ac in eastern Oregon (Larsson et al. 1983), 120 ft 2/ac in the Black Hills of South Dakota (Schmid and Mata 1992), 150 ft 2/ac in the Black Hills and elsewhere in the Pacific Northwest (Sartwell and Stevens 1975), and 170 ft 2/ac (Oliver 1995) in the eastern Sierra Nevada. These studies also reported a site index value, or a plant association, from which site index could be determined. Ponderosa pine growth was simulated over a 100 year period using the Forest Vegetation Simulator (FVS) East Cascades Variant (Wykoff et al 1982) on an initial stand density of 400 TPA of ponderosa pine, to generate the curves in Figure I.2. Curves differ by habitat type because the underlying growth equations are driven by a combination of site quality variables, including site index and maximum stand density index. By comparing the field study results with the simulated growth curves it appears from Figure I.2 that MPB thresholds vary across major habitat types that support ponderosa pine, giving credence to the hypothesis that site carrying capacity plays a role in MPB events. However, no researcher has detected a significant relationship between site index, as a measure of site carrying capacity, and MPB thresholds, although McCambridge et al. (1982) did test this possibility. The lack of a significant relationship between site index and MPB thresholds may be a result of the variability in basal area productivity within a site class.
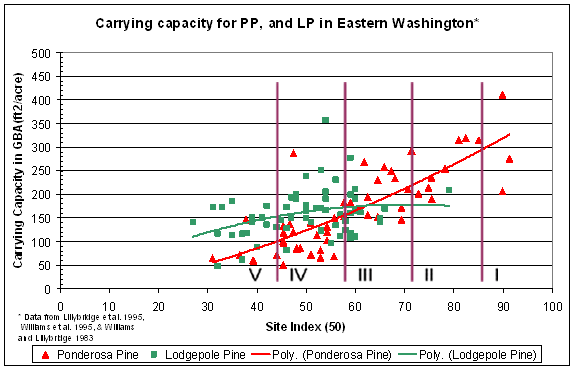
In dry interior forests, Hall (1989) found that site productivity, measured by growth in basal area, can vary as much as five times for a given tree site index. This broad range in growth and basal area for a given site index suggests that an assessment of carrying capacity using traditional site index measures alone would be inadequate for predicting susceptibility to attack for a given stand. For example, Figure I.3 illustrates the difference in carrying capacity as measured by Hall’s (1987, 1989) growth basal area (GBA) for ponderosa and lodgepole pine, across the range of habitat types that contain them, on the Colville, Wenatchee, and Okanogan National Forests. These data indicate that ponderosa and lodgepole pine, in stands of identical age, stocking, and diameter, would experience widely disparate levels of stress due to inherent site carrying capacity. Figure I.3 indicates that for a ponderosa pine stand with 150 ft 2/ac of basal area, there would be minimal competitive stress on the trees in 24 of the 51 habitat types under average weather conditions. With little competitive stress the possibility of developing MPB outbreaks under historic climatic conditions is greatly reduced. However, at those same stocking levels, ponderosa pine may be under severe stress in the 21 habitat types which have a GBA well below 150 ft 2/ac.
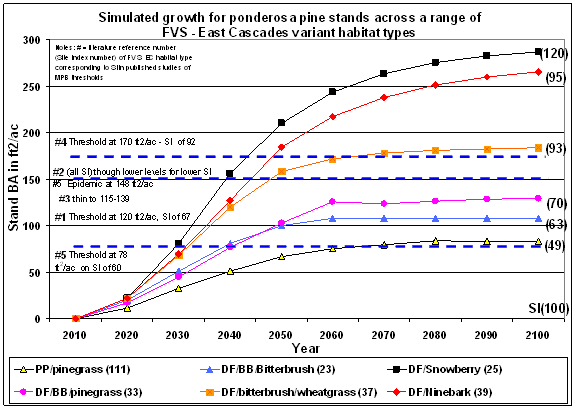 |
Figure I.2: MPB basal area thresholds relative to site quality given by habitat type (of a given site index) or site index. (Figure 2 References Numbers: 1) Schmid and Mata 1992 2) Sartwell and Stevens 1975 3) Sartwell 1971 4) Oliver 1995 5) Larsson et al. 1983) |
In contrast to ponderosa pine, lodgepole pine shows little increase in GBA with increasing site index as indicated by the best fit polynomial line in Figure I.3. This flat GBA response curve may reflect the poor self-thinning response of lodgepole on poorer sites, or the low nutrient demands of lodgepole as compared to ponderosa pine. These differences between the two species suggest that whereas stand parameters and climate will likely play a significant role in determining lodgepole pine susceptibility, for ponderosa pine, stand carrying capacity may be a more significant predictor of susceptibility to MPB attack. Under changing climatic conditions, carrying capacity can be expected to change for both species. The first impacts may be noted in lodgepole pine because it typically occurs on sites with less water-holding capacity than that of sites where ponderosa pine grows. Assessing climatic influence on historic carrying capacity should improve our ability to determine how carrying capacity will change with changing climate.
 |
Powell (1999) developed stocking relationships that incorporate carrying capacity by tree species, plant association (habitat type), and ecological province for southeastern Washington and northeastern Oregon. Powell (1999) incorporates Cochran et al.’s (1994) work on stocking levels that can reduce stand stress, and thus insect attack into stocking level recommendations for lodgepole and ponderosa pine. Powell suggests using stand density index (SDI) (Reineke, 1933), and relative density (RD) (Curtis, 1982), to develop stocking level guides that “delineate a management zone in which stand densities are presumed to be relatively resistant to insect and disease problems” (p 2, Powell, 1999). Powell’s work suggests that MPB susceptibility is influenced by site-specific stocking levels, but this presumption has not been tested for the remainder of eastern Washington. My study looks at northeastern Washington and the northern part of the East Cascade Range to determine appropriate linkages between stocking levels, carrying capacity, and MPB susceptibility in those regions.
Given the wide range of stand susceptibility thresholds reported in the literature, and the apparent variability across site qualities, (Figures I.2, I.3, and Powell’s (1999) implementation guide), it is clear that more work can be done to elucidate the specific relationships between site, stand, climate, and MPB susceptibility thresholds. Although various treatments have effectively reduced MPB impacts in specific localities, transferring these same recommendations to other areas has not always achieved successful results. Establishing the relationship between easily measured stand parameters, stand carrying capacity, and susceptibility thresholds may provide the necessary ‘missing link’ to develop treatment recommendations that are broadly applicable across the landscape. This strategy would permit the practitioner to integrate site specific variables into a model that is transferable across ecological scales. According to Peterson and Parker (1998), there is a “relatively small amount of crucial information that links different levels of function”. Stand carrying capacity will be tested for its value as the ‘small amount of crucial information’ that permits the successful transfer of treatment recommendations proven in one place to other locations on the landscape.
From the conceptual model of tree susceptibility, and a review of the literature, there appear to be two central questions about MPB / host interactions that can and should be answered to improve our understanding of the factors creating the substantial threats from MPB that are facing eastern Washington today: “What role does the relationship between stand and site variables play in host susceptibility to MPB?” and “What role do climate and weather play in host susceptibility to MPB?” Chapter one looks at carrying capacity and how it influences stand susceptibility to MPB outbreaks. Chapter two explores the impacts of climate on stand susceptibility to MPB outbreaks.
Chapter 1: Stand Carrying Capacity Influence on Mountain Pine Beetle Susceptibility in Lodgepole Pine Stands of Eastern Washington
Introduction
Eastern Washington forests are subject to many disturbance agents. Outbreaks of Mountain Pine Beetle (Dendroctonus ponderosae Hopkins) (MPB) occur in pine forests throughout the region as part of naturally occurring disturbance regimes. However, the affected acreage has increased substantially in recent times, as has the number of trees per acre that have died. Figure 1.1 summarizes the mortality on national forest lands from 1979-2004. Mortality numbers are derived from calculations on GIS data provided through the USFS Forest Health protection website at: www.fs.fed.us/r6/nr/fid/data.shtml. For this study, I focus on lodgepole pine (Pinus contorta Dougl. var latifolia Engelm) (LP) susceptibility to MPB as it manifests in the national forests of eastern Washington.
Historically, thinning to reduce density, and thus tree competition and stress, was successful in mitigating the spread of MPB across the landscape (Mitchell et al 1983, Waring and Pitman 1985, Amman et al. 1988). However, optimal post-thinning stand density thought to reduce stand susceptibility varies considerably by species and location (Sartwell and Stevens 1975, Larsson et al. 1983, Oliver 1995). Studies on MPB susceptibility and risk have focused on stand metrics, beetle population metrics, or some combination of the two, to arrive at broad generalized ratings of risk, hazard, and susceptibility. These rating systems are helpful in explaining local relationships, but fail in predictive capacity at larger scales (Amman and Anhold 1989, Shore et al. 1989, 2000). Incorporating site carrying capacity as a predictor of stand susceptibility to MPB attack may allow us to refine our rating systems, and treatment regimes, so that they are broadly applicable across the landscape.
This study looks at methods of incorporating carrying capacity into predictions of susceptibility and tests them using known instances of MPB attack. Specifically, the study asks “What role does the interaction between stand and site variables play in host susceptibility to MPB?” I define MPB attack as a binary response variable [0=no attack, 1= attack]. Predictor variables include a site carrying capacity variable estimated by growth basal area (GBA), basal area of susceptible species, total stand basal area, age of susceptible pine, pine diameter, density, slope, elevation, slope position, and aspect. The intent is to determine the relative contributions of stand versus site variables in predicting lodgepole pine susceptibility to MPB attack.
Previous MPB hazard rating systems have used stand parameters such as basal area (BA), density measured in trees per acre (TPA), average or quadratic mean diameter (QMD), crown competition factor (CCF), periodic growth rates, age, and percentage of host species in a stand (Amman et al. 1977, Schenk et al. 1980, Stuart 1984, Anhold and Jenkins 1987, Chojnacky et al. 2000, Mata et al. 2003) to estimate stand susceptibility for either lodgepole pine or ponderosa pine. Shore and Safranyik (1992) developed a risk rating system that includes stand density (from all species) multiplied by a factor for species composition (% BA of pine species). This rating system has had significant success in predicting stand mortality in lodgepole pine (Shore et al. 2000).
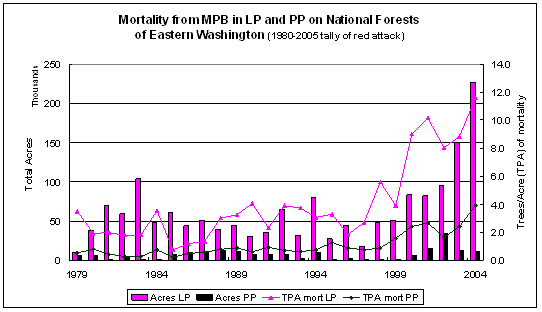 |
Figure 1.1: Mortality trends from MPB attackin National Forests of Eastern Washington for lodgepole and ponderosa pine, 1979-2004 based on a summary of available GIS data. |
Shore et al (1989, 2000), provide an assessment of the risk-rating systems for lodgepole pine that have been developed over the past few decades. The evaluation indicates that many of the hazard or risk rating systems inadequately predict results when expanded outside the region where they were formulated. Similarly, Amman and Anhold (1989) found that individual predictor variables commonly used in risk rating systems for MPB infestation of lodgepole pine varied widely in their predictive power across the national forests where they were tested. For example they found that quadratic mean diameter (QMD) explained 68.6% of the variance in the Deschutes National forest, but only 0.6% in the Colville National Forest. Likewise, stand basal area explained 45.5% of the variance in the Winema National Forest, but only 0.1% in the Deschutes National Forest.
Basal area thresholds at which ponderosa pine become susceptible to attack vary from less than 78 ft 2/ac (Larsson et al. 1983) up to 170 ft 2/ac (Oliver 1995). Sartwell and Stevens (1975) found an average threshold of 150 ft 2/ac for ponderosa pine in the Black Hills and also found that outbreaks start at earlier stand ages on good sites than they do on poor sites, yet higher pine density can be supported on good sites without damage. The variability in predictor variables noted by Amman and Anhold (1989) and Shore et al. (1989) for lodgepole pine, and the range of results found across different habitat types for ponderosa pine, indicate that more refinement of stand susceptibility thresholds is needed.
Research on many aspects of the MPB and its hosts has been conducted over the past 40 years. Studies have examined physiological parameters associated with the host trees such as resin pressure (Raffa and Berryman 1983) and phloem width ( Amman, 1972). Physiological mechanisms of the bark beetles such as pheromone use for aggregation (Pitman et al. 1968) and disaggregation (Rudinsky et al. 1974), flight patterns (Geiszler and Gara, 1978), ecological interactions (Gara et al. 1985), and symbiotic relationships with Ceratocystis fungi (Ballard et al. 1984) have all been thoroughly explored. Even the impacts of weather and climate on MPB survival and dispersal have been studied (Safranyik 1978, Carroll et al. 2003).
Typically trees in the most densely stocked forests are the first to be attacked and killed by MPB (Mitchell and Preisler 1991). The first trees attacked during the MPB flight are identified as focus trees (Geiszler and Gara 1978). Focus trees show the slowest growth rate and are the most stressed of all the trees in the stand. Flying beetles that land on focus trees are able to feed without being ‘pitched out’ thus producing aggregating pheromones (Raffa 2001) which draw additional MPB into a stand. Once there are sufficient numbers of MPB in an area, they “switch” from attacking stressed trees to attacking nearby trees, which are not necessarily stressed, with increasing levels of attack at closer distances and on larger trees (Geiszler and Gara 1978). “Switching” is attributed to the synergistic effects of aggregating and anti-aggregating pheromones produced by the incoming beetles. The switching mechanism is driven by temperature, MPB population levels, and the number of focus trees.
The switching mechanism is the precursor to epidemic outbreaks of MPB, for without a sufficiently high MPB population to produce switching behavior, only endemic population levels can persist (Geiszler and Gara 1978). In order for a high MPB population to develop, successful reproduction must occur. Successful reproduction depends on having a large number of trees whose defense mechanisms are insufficient to pitch out the MPB. The very tight synchrony between host stress and successful MPB attacks suggests that the precursor to a MPB outbreak is an increase in host susceptibility. By looking at site specific variables that affect host susceptibility, we can clarify the role that these precursor conditions play in generating a MPB epidemic.
Focus trees are under stress which predisposes them to MPB attack (Gara et al. 1985) but not all sites demonstrate the same degree of stress at the same stocking levels. Although studies have quantified a number of the stand parameters such as age, density, and size that lead to increased susceptibility to MPB outbreaks, they have not identified the underlying mechanisms that produce highly variable thresholds and equally high mortality under dissimilar stand conditions. One reason for the equally high mortality under dissimilar stand conditions can be linked to beetle pressure as defined by Shore and Safranyik (1992). A second reason for the lack of specificity of mortality may be the absence of site carrying capacity estimators that can relate stand density and basal area measures to estimates of stand stress.
Site carrying capacity, as it relates to tree growth, has not been incorporated into estimates of host susceptibility to MPB attack. The nearest estimator of carrying capacity that has been used as a predictor of stand susceptibility is ‘habitat type” (Roe and Amman 1970, Cole 1973). Cole (1973) found that stand basal area and habitat type were the first and second most useful variables for predicting phloem thickness respectively. Cole (1973) related phloem thickness to tree vigor and susceptibility to MPB attack. Carrying capacity estimates have been determined for most Eastern Washington habitat types (Williams and Lillybridge 1983, Lillybridge et al. 1995, Williams et al. 1995), but the range of estimates is very broad within any particular habitat type. Also, concern about the long-term utility of current habitat typing arises because species respond individually to shifts in climate pattern, rather than in their current assemblages (Hansen et al. 2001). As such, we can expect habitat types to undergo a radical transformation in response to climate change. These limitations suggest that using habitat type as a surrogate for carrying capacity for predicting susceptibility to MPB attack is inadequate. An alternative measure of carrying capacity that is broadly applicable across the landscape is needed. Because stands are attacked when they are below a theoretical ‘maximum carrying capacity’, such as that identified by maximum SDI (Reineke 1933), the carrying capacity metric must identify the threshold of stocking at which trees become susceptible to MPB attack. A first step is to define site carrying capacity, and then determine an appropriate way to measure it that captures the host-insect dynamic.
Site carrying capacity can be defined as “the maximum number or biomass of organisms of a given species that can be sustained or survive on a long-term basis within an ecosystem” (Helms, 1998). There are a number of measurements that quantify carrying capacity for forest stands, such as Reineke’s (1933) stand density index (SDI) also known as the -3/2 rule, and Daniels et al. (1979a) additive version of SDI for multi-cohort stands. Implicit in these estimations of carrying capacity is that self thinning from suppression mortality reduces the living biomass on a particular site, with the smallest diameter trees in understory cohorts dying first. In contrast, Oliver (1995) suggests that self thinning in ponderosa pine is mediated by bark beetles rather than suppression mortality, with the overstory cohort succumbing to the insect, rather than the smaller diameter understory cohort. Oliver (1995) also found that bark beetle induced mortality occurred at SDI’s that were lower than the line of imminent mortality in Reineke’s (1933) or Daniels et al. (1979a) studies and that MPB induced mortality changed SDI abruptly because mortality occurred episodically and was concentrated on larger-diameter trees. Oliver’s observation for ponderosa pine is congruent with other ecological studies that show density or biomass of species is reduced in a wide variety of ways to maintain species biomass with specified limits (Leopold 1966, Berrryman 2002, Garrison-Johnston et al. 2003). Regardless of whether mortality occurs on the larger diameter trees or the smaller ones, growth rates on all trees decline before maximum site carrying capacity is reached. That decline in growth rate is associated with MPB attack (Waring and Pitman 1983, Sartwell 1971).
Hall (1987) used data from Sartwell and Stevens (1975) on bark beetles in the Black Hills as part of a site carrying capacity measurement called Growth Basal Area or GBA. GBA is the basal area a stand can carry at 100 years of age while maintaining a growth rate of 1” per decade in radial increment on the dominant trees. The measure is indexed to stands of 100 years of age much as site index is indexed to 100 or 50 years. The 100 year index for GBA was chosen to coincide with the region of the ‘GBA over age’ curve that approaches an asymptote. One inch per decade of radial increment was chosen as the reference value for the GBA index because at that diameter growth rate:
- stands have sufficient inter-tree competition to slow height growth, but not so much as to induce suppression mortality;
- trees have reduced susceptibility to MPB and
- trees have a live crown ratio of at least 45% which is recommended for a thinning response (Hall, 1989).
Hall (1987, 1989) developed the procedures and mathematics for determining GBA. Procedures for estimating GBA include measuring total stand basal area, and the age and diameter increment of at least five dominant trees, per species, in the stand. Only those trees with declining growth rates will provide a reliable estimate of GBA and as GBA is a species specific measure it can only be obtained for those tree species that represent more than 20% of the stand basal area.
Once field data are gathered, a few simple calculations are needed to determine GBA. First, the current stand basal area is related to a stand basal area where the dominant trees are growing at the 1”/decade rate for an estimate of GBA and then an age correction is applied. The following equations for determining GBA for lodgepole and ponderosa pine are found in Hall (1987, 1989).
First, calculate a conversion factor (CF) that relates current stand growth rates to the index rate of 1”/decade.
For pine species the equation is
CF = 0.436 + 0.0094(DID) + 0.000506(DID) 2
where DID is diameter increment per decade measured in 1/20th of an inch.
To correct GBA for age effects, determine the appropriate age correction (AC) depending on the age of the stand.
For age 20-99 years:
AC = 1.8115 - 0.0245(AGE) + 0.000165(AGE)2
For age 100-300 years:
AC = 0.90 + 0.001(AGE)
GBA is then calculated as:
GBA (ft 2/ac) = BA x CF x AC
The simplicity of the measurement and assessment of GBA makes it useful in operational settings, and for the analysis of large scale inventory databases such as the Forest Inventory Analysis (FIA) and Continuous Vegetation Survey (CVS) plots in the region. However, assessing carrying capacity with GBA alone does not provide sufficient context for understanding susceptibility to MPB as a function of current stand conditions on a particular site. It is quite likely that GBA will not explain all the variation in current MPB attack because it reflects past climate and not current drought, weather, or climate impacts that are correlated with insect attack (Hessburg, 2005). Waring and Law (2001) state that “any empirical predictions … based on past management experience may no longer apply” when discussing the physiological response of ponderosa pine to climatic change. However, I expect that the ratio of stocking to carrying capacity, a measure that I call the GBA ratio, will be a dominant variable in years when drought is driving the MPB – host interaction. The importance of the GBA ratio as a predictor is expected to increase under drier conditions because focus trees are needed for the MPB to proliferate, and focus trees would become more prevalent when the stand is under water stress caused by drought.
Methods
Study area
The study area comprises the Okanogan (OKA) and Colville (COL) National Forests (NF) in eastern Washington. Other eastern Washington national forests were also considered, but the Wenatchee (WEN), the Washington side of the Umatilla (UMA), and that portion of the Gifford Pinchot (GP) NF east of the Cascade crest, had very limited MPB activity during 1979-2004, for which spatially explicit MPB attack information and climate data were available. The part of the Kaniksu National Forest in Washington State was not included, as inventory data was gathered using a different procedure than those used for the other national forests.
Inventory Data
National Forest Continuous Vegetation Survey (CVS) plot data for the national forests under consideration were obtained to determine site and stand characteristics for all plots that contain a component of susceptible lodgepole or ponderosa pine. The CVS data are collected on a 1.7 mile grid (3.4 mile in wilderness areas) across national forests (Figure 1.2). The CVS plot is one hectare (2.47 acre) in size with a series of five sub-samples identified as stake positions radiating from the center of the plot. Stake positions are approximately ½ acre in size. I considered each stake position as one of five sub-samples at each plot location that give different estimates of the population – some with pine in them and some without pine. The CVS data is summarized at the stake level for any stand measure of interest including density, QMD, basal area, and species composition. Because trees experience competition from their nearest neighbors and are not generally affected by competition from their neighbors ½ acre away, I assess competition metrics, and GBA estimates, at the stake level rather than a plot level. The average for all stakes with susceptible pine was used as the overall plot average. This method avoids pseudo-replication errors (Hurlbert, 1984) associated with linking coarser scale aerial survey and climate data to the specific plot location, while ensuring that the most accurate estimate of competition at the stake level was used.
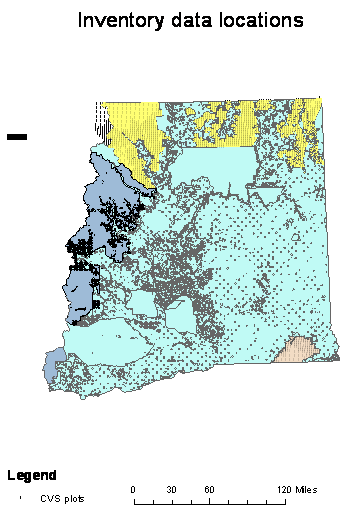 |
Figure 1.2: Plot locations for all Okanogan and Colville NF CVS plots. |
Of the 2243 CVS plots on Eastern Washington National Forests, 1467 have a LP and/or a ponderosa pine (Pinus ponderosa Laws) (PP) component in what have historically been considered susceptible size (>8” dbh) and age class (>60 years) ranges. An additional 166 plots with pine in smaller diameter classes were added to the susceptible pine plots after initial analysis determined that stands where the trees averaged 4-6” in diameter were within areas where MPB had attack according to the aerial survey. The susceptible pine plots were loaded into an Access ™ database and queried for a range of stand and site variables. The stand variables of interest include trees per acre (TPA), basal area (BA), and quadratic mean diameter (QMD) of live, dead, recently dead, and susceptible pine, age, percentage pine, diameter increment, stand volume, GBA, and insect and disease ratings. The site variables of interest include elevation, aspect, slope and slope position (PHYSIO). All variables of interest can be derived directly from queries of the database for all plots except for site carrying capacity as measured by GBA. GBA was calculated for those plots and tree species where diameter increment was provided, using the methods of Hall (1987, 1989).
Aerial Survey Data on Mountain Pine Beetle Attack
Every year the Washington State Department of Natural Resources conducts an aerial survey of forested portions of the state to determine the nature and extent of major insect and disease outbreaks (http://www.dnr.wa.gov/htdocs/rp/forhealth). These trend data are collected and collated by participating states and maintained at the USFS Forest Health Protection branch. Digital maps containing location detail and information on the type, intensity, and extent of forest damage were downloaded from the Forest Health Protection site for the years 1980 to 2005. The site is at http://www.fs.fed.us/r6/nr/fid/as/index.shtml. The data were imported into an ARCGIS 9.0 database and queried to identify all polygons where MPB had attacked either PP or LP on National Forests in eastern Washington over the 26 year period. The aerial survey captures MPB ‘red attack’, which is the point when the tree’s needles turn red in the year following successful MPB attack. The aerial survey data have been adjusted to reflect the year that mortality occurred (Figure 1.1).
Climate Data
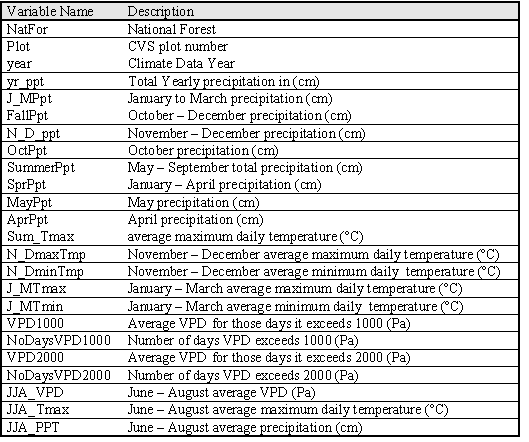
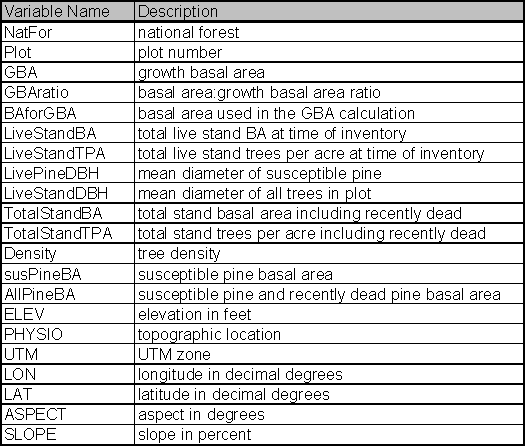
I used the DAYMET model (Thornton et al 1997) to estimate site specific climate variables for each inventory plot. The DAYMET algorithms interpolate data from irregularly spaced climate station data. DAYMET daily weather observations for maximum, minimum, and daily average temperature, precipitation and vapor pressure deficit for the decade prior to the inventory date on each plot were used to calculate weather variables that would be useful for estimating GBA (Table 1.1).
| Table 1.1: Climate Factors |
 |
Estimating Carrying Capacity
GBA values were calculated for all plots where radial increment data was available. Despite applying age corrections as required in the GBA calculation, paired-plots (Figure1.3) indicates that there is a prominent ‘age effect’ within the data distribution. Younger stands having a much higher estimate of GBA, and a wider variance than GBA estimates obtained from stands older than 80 years. Likewise, after approximately 150 years, GBA steadily declined.
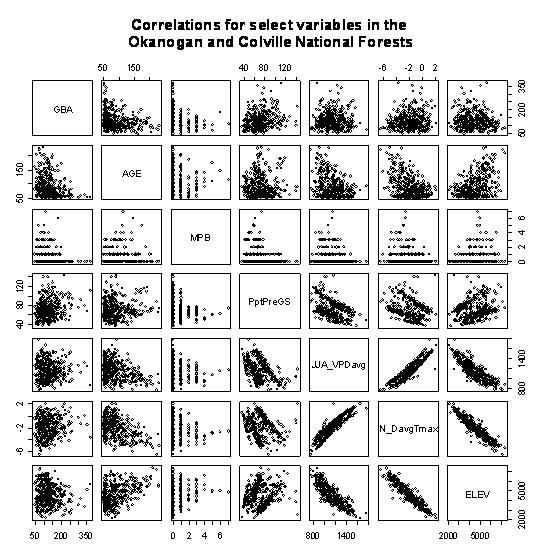 |
Figure 1.3: Variable interactions for GBA predictors. Age captures trends in elevation, VPD, summer and winter temperature, and GBA. |
The estimates of GBA were corrected in the following manner in order to minimize the age effect. First, all radial increment sample trees greater than 250 years old or less than 50 years old were eliminated from the sample, as GBA estimation procedures were developed within the 50-250 year old age range. Second, all trees < 5 inches DBH were eliminated, as were those with radial growth rates >3 inches per decade. These measures follow from Hall (2003) who indicates that GBA can only be reliably calculated on stands where inter-tree competition is beginning to inhibit growth rates and where average tree diameter exceeds five inches. And finally, all trees that were not in a dominant or co-dominant crown position and larger than the stand QMD were eliminated, as GBA is estimated from the dominant trees in the stand. The final number of tree samples used to estimate LP GBA was 2,124. These trees are located across 1,339 stake positions located within 574 plots.
Figure 1.3 indicates that age is positively correlated to elevation, and negatively correlated to average VPD when it exceeds 1 kPa, average summer VPD, winter temperature, and GBA. In effect, the CVS sample of GBA underlines the fact that inventory at higher elevations is older. As higher elevations tend to be wetter, cooler, and support more basal area than their counterparts at lower elevations, the ‘age effect’ reflects a collinear relationship to various climate variables.
GBA was regressed against site and climate predictor variables using the R statistical package (http://cran.r-project.org). All climate and site variables were initially included in the regression. Backward elimination (ά = 0.05) was applied to select only significant predictors of GBA variation.
Model coefficients and significance levels for GBA predictors (Table 1.2) include average summer VPD, autumn VPD, number of days that VPD exceeds 1.5kPa, pre-growing season precipitation and latitude.
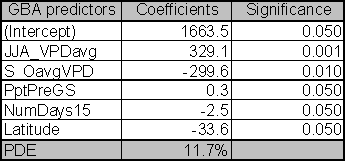 |
Plots of residual and fitted variables for this model indicate homogenous variance and normal residuals. Although, these are the best predictor variables for GBA, they explain only 11.7% of the variance. Given the low explanatory power of these predictors, I used only those stands where measured GBA values existed to estimate the relationship between stocking, site carrying capacity, and MPB attack, rather than estimating the GBA of those LP plots without GBA using these relationships.
The ratio of stand basal area to GBA was used to determine an index of stocking for each susceptible pine plot relative to its carrying capacity. This value is identified as the GBA ratio in the statistical tests. A GBA ratio > 1 indicates that the stand is carrying more basal area than the site can support while maintaining 1 inch/decade of diameter increment on the dominant trees.
Integrating the Data Sets
To link the aerial survey trend data to forest inventory, CVS plot locations were imported into ArcGIS 9.0 and overlain on annual survey data. The plot coordinates, biophysical characteristics, and MPB attack statistics were collected for each year of survey. The MPB hit plots were then linked back into an Access ™ database with inventory and site data for all available plots. Comparisons of ground and aerial survey data gave a correlation of 0.96 when comparing the number of polygons with CVS data to the acres of MPB attack and a correlation of 0.95 when comparing the number of CVS plots to MPB attacked acres. The correlations were substantial enough to use the ground inventory data as a proxy of stand conditions within MPB attacked polygons.
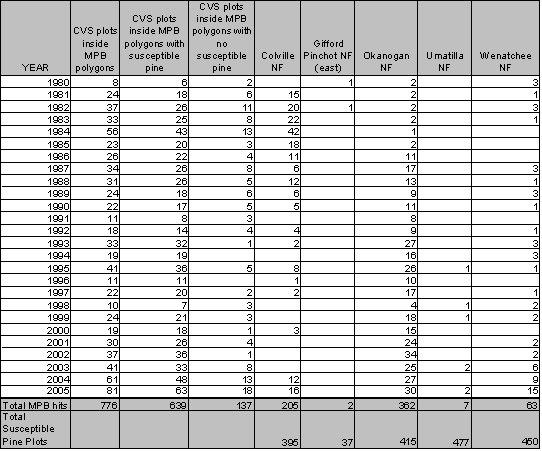
A summary of the number of plots with susceptible pine, and those that are within a MPB attack polygon, is given in Table 1.3. The MPB attacks on CVS plots cover 466 unique locations, many of which were identified as attacked over several years. There are a total of 776 instances where CVS plots were located inside MPB polygons. In 118 instances, CVS plots are identified as being within MPB hit polygons (Table 1.3),but lack the requisite species mix or diameter distribution to be considered susceptible pine. These plots that have MPB ‘attacks’ in what would be considered ‘non-susceptible pine types’, and in types with no pine inventory, may be considered errors in the aerial survey method. Alternatively, an exploration of the data suggests that the ‘attacks’ in areas without susceptible pine have other attributes that suggest that there is MPB activity in the area, though it is not captured in the plot data. These plots include plots located along rock bluffs where pine may be in the vicinity though not in the plot. Some of the plots that the aerial survey identified as MPB attacks had no susceptible pine at the time of the ground inventory which started in 1993. However, these plots do have a substantial pine component in the appropriate size class identified as standing snags which may have resulted from MPB attack in the 1980s and early 1990s. A third portion of the MPB ‘attacked’ plots have a mean diameter in the 4-6” range which is less than the diameter that has historically been considered susceptible.
Table 1.3: Location and number of CVS plots with MPB attacks |
 |
Modeling
One way to assess relationships between MPB attack and site and stand variables is to treat MPB attack as a binary variable. Those plots identified as “MPB hits’ because they overlap with MPB infestations, are coded as [1]. Those without attack are coded as [0]. For each year, a plot will be coded as [0] or [1] depending on its attack status. Generalized linear models of the binomial family (GLM-B) are used to identify the best predictors of MPB attack.
However, Cox and Wermuth (1992) caution that the transformation of binary data using GLM-B’s is only appropriate when at least 20% of the population is either a [0] or a [1] for the model relationships to hold). As the full dataset with number of attacks by year had a ratio of hit to un-hit samples across all years of approximately 1:39, and a ratio in the epidemic years (2000-2004) of approximately 1:24, measures to address the preponderance of zeros within the data were needed.
The data were aggregated to ensure that they fell within an acceptable probability ratio range. Assessment was then conducted using a GLM-B model to regress MPB attack against predictor variables. Evaluation of Table 1.3 indicates that the most explanatory power will come from assessing the MPB attacks in the Colville and Okanogan National Forests. They have the largest distribution of attacked plots in any given year and over time. These forests experienced 93% of all attacks that occurred on eastern Washington national forests from 1979-2004. By segregating these two national forests from the remaining areas, there was a substantial improvement in the probability ratio necessary to use GLM-B techniques. Stand metrics for those stands that were not hit at any time in the 25 year period were aggregated across inventory measurement periods and assigned a [0] value. All stands that were attacked were assigned a [1], regardless of the date of attack or number of attacks that the stand had endured. For stands that were attacked, stand data from the inventory sample closest to the date of attack were used in order to arrive at a reasonable estimate of stand conditions at the time of attack. Plots that were hit after the stand was inventoried have the most reliable estimate of stand and stocking conditions, as all live pine were considered part of the susceptible stand. Plots that were hit more than seven years prior to inventory were not included in the estimation procedure, as no reliable way of estimating stand metrics at the point of attack is available. For plots that were hit no more than seven years earlier than the inventory date, data on dead trees, including the pine component, were included in estimates of stand metrics that would have been present at the time of the attack. Because the inventory data classifies dead trees according to decay class, this procedure ensured that only the most recently killed trees were included in the stand metric calculations. The addition of these recently dead trees to the stand component is estimated to capture the bulk of the competitive interactions in the stand at the time of attack. The bulk of the stands were inventoried within seven years of an attack, but a few were inventoried up to ten years prior to an attack. The [0, 1] ratio for the Colville and Okanogan National Forests is approximately [0.35:0.65]. Given the substantial change in the nature of MPB attack that started in the year 2000, the analysis was split into two distinct time periods, 1979-1999 and 2000-2004. The entire period was also tested to determine an overall suite of predictor variables.
The databases were queried using the R statistical package. A GLM-B function was called in R to determine relationships between MPB activity [0, 1] and the site and stand variables of interest. As prior studies have determined that age, stand density, basal area, diameter, and species composition have historically been predictors of MPB attack, these variables were initially targeted for model building. The GBA ratio was also included in model building. After these preliminary tests, a full model was fit using all site and stand variables. Backward elimination was used to determine a best fit model from the range of stand and site variables that were available.
Assessments of ‘best fit’ used the Akaike Information Criterion (AIC) score (Akaike, 1973), rather than R2. According to Cox and Wermuth (1992), R2 is not suitable for assessing regressions based on a binary response variable. The highest possible R2 value attainable from estimating binary data using unweighted least squares methods is 0.36, with a more likely value in the range of 0.09 even if there are significant relationships present within the data.
The AIC is calculated by:
AIC = 2k – 2 ln L
Where k is the number of parameters and L is the likelihood function . The AIC with the lowest value corresponds to the model with the best fit. The AIC is designed to promote parsimony in the model selection process, as over-fitting the model is penalized with an increase in the score. However, with a large number of data points such as I have, the model with the lowest AIC score sometimes included non-significant variables. To eliminate the non-significant variables and still have a ‘best fit’ model I dropped the non-significant variables one at a time, starting with the least significant one. I continued that procedure until all the variables were significant or I had increased the AIC by no more than 2. Keeping the AIC difference within 2 is supported by work by Burnham and Anderson (2002). Burnham and Anderson (2002) proposed a technique for determining relative model strength called the ΔAIC (Delta AIC). The ΔAIC determines if another model within the hierarchy of nested models might fit the data equally as well as the ‘best model’. A ΔAIC difference of <=2 between the models suggests that the alternate model may be equally effective in explaining the relationships between predictor and response variables with a new dataset. A ΔAIC difference of 3 to 7 suggests that the alternate model is not well supported. A ΔAIC difference of >10 suggests that the alternate model is a highly unlikely alternative. By dropping non-significant variables and maintaining the AIC within 2 points of the lowest AIC, I was able to develop more parsimonious models that considered additional information about the relationships between the variables in each model.
A type of ‘pseudo-R2’ can be calculated using the ratio of AIC values for the null model (intercept only) and the best model with the lowest AIC value as given by: R2AIC = 1 – (AIC0/AICi). This pseudo R2 is taken as a measure of the ‘reduction of entropy’ suggested by the model (Sakamoto et al. 1986). A second type of pseudo R2 is the estimate of Percentage Deviance Explained ((PDE). For each additional variable added in the GLM-B procedure, the program calculates the amount of additional deviance explained and returns both total deviance explained and residual (unexplained) deviance. The PDE is given by (1- (residual deviance/null deviance)). The model with the highest PDE gives the lowest AIC. The AIC score was used to determine which model was the best fit, the ΔAIC was used to remove non-significant variables if necessary, and the PDE was used to determine how much variability had been explained.
Results
The significant predictors and PDE for each best fit model are given in Table 1.4. Data relationships were estimated for the entire time period, and for subsets that capture MPB attack in 1980-1999 and 2000-2004. The model for the entire time period includes significant variables from both time periods. As expected from earlier studies, age, pine DBH, density, diameter and density interactions, and basal area are included in the ‘best fit’ full model up until the year 1999. The GBA ratio and elevation are also significant predictors for the 1980-1999 period. After 1999, pine density and basal area are dropped from the model as they no longer have significant predictive power. Under the conditions since 2000, GBA, age, GBA ratio, crown ratio (CR), and pine DBH are significant stand and stocking level predictors. Elevation and slope position (PHYSIO) are also significant site level predictors from 2000 forward.
Because the AIC is driven by the likelihood statistic, comparison of AIC values across non-nested models is not possible. But by fitting the same predictors to different time periods and assessing differences in explanatory power and variables, some inference regarding ecological conditions can occur. To assess whether the models for the two periods are substantially different or only nominally different, I used the 2000+ data in the 1999 model and vice versa. For the 2000+ model ran on 1980-1999 predictors, the AIC score was 31 points higher than the best fit model. For the 1980-1999 data ran on 2000+ predictors, the AIC scores were 57 points higher than the best model identified in Table 1.4. Using the pre-2000 variables as predictors for the 2000+ data reduced the PDE by 2.7%. The reverse test, where 2000+ predictors were assessed for their strength in predicting pre-2000 relationships, reduced PDE by 4.4%. From these results, it is clear that the predictors for the ‘best fit’ models have shifted substantially between the two time periods. This result indicates that LP susceptibility to MPB as a function of stand level attributes has fundamentally changed in response to some external variable for the period 2000-2004.
| Table 1.4: Best fit models of stocking, stand, and site variables |
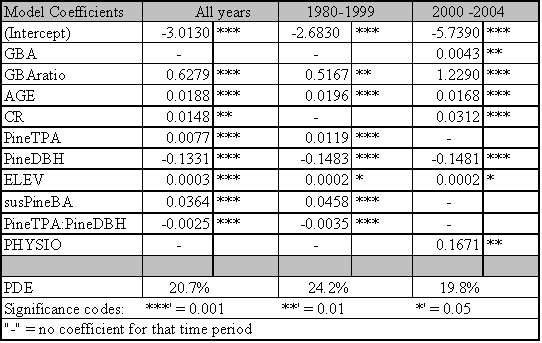 |
The PDE for the model covering 1980-1999 is 24.2%. PDE dropped to 19.8% for 2000-2004. The estimate of deviance explained by individual predictor variables within the ‘best fit’ models is sensitive to the order in which the variables are added. If a variable was added first, it tended to explain more deviance than if it was added last. Interactions between the terms in the model mean that the best fit model does not explain the PDE that is equal to the sum of the PDE explained by its components.
However, it is useful to determine the ranking of individual predictors and their contribution to PDE. Individual predictors were tested separately for each time period and those tests identify age as the dominant predictor across all time periods with a PDE ranging from 10.9-11.6%. Elevation and GBA ratio rank second and third for the 2000-2004 and ‘all years’ models and tie for second place rank in 1980-1999 with their PDE ranging from 5.2-7.2%. Susceptible pine basal area ranks in 4th place for all time periods. GBA ranks 5th for 1980-1999 (PDE 4.8%) and the ‘all years’ (PDE 2.7%) categories, and 6th for 2000-2004 (1.1%).
Discussion
Historical studies indicate that host susceptibility to MPB attack is influenced by a complex interplay of stand and site characteristics that drive water stress, influence stand structure, and affect stand and tree vigor. The most accurate MPB prediction systems to date have included climate and beetle population variables as well as host susceptibility estimates (Shore et al. 2000). Because climate and MPB population factors were deliberately excluded from this assessment in order to isolate host susceptibility predictors, it was anticipated that only a portion of the potential explanatory power for predicting MPB attack would be available. The portion that was attributable to host susceptibility was unknown. This analysis indicates that 24.2% of the deviance in MPB attack is directly attributable to a combination of site and stand variables for the 1980-1999 time period. Since 2000, the contribution of site and stand variables to predicting MPB attack is reduced to 19.8%. The decline in PDE from 2000-2004 suggests that other variables are more significant than stand variables as predictors of MPB attack during that time period.
GBA increases with elevation for this particular data set and trend analysis indicates that virtually all of the increase in MPB attacks since 2000 has occurred above 5000 feet in elevation. The inclusion of GBA as a significant predictor from 2000 forward likely reflects the positive correlation between GBA and elevation.
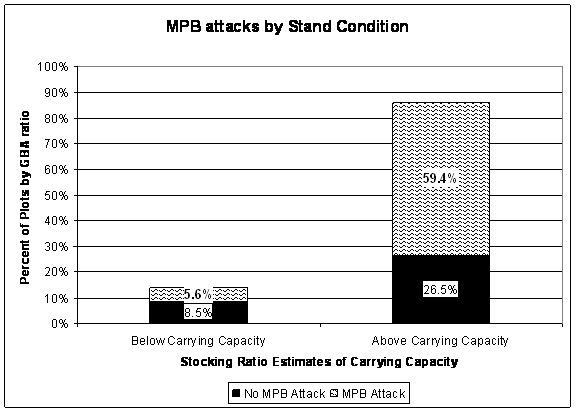
While stands can carry more basal area than the value estimated by GBA, growth rates decline and tree stress increases. Increased tree stress and growth rate decline are associated with MPB outbreaks because of the increase in focus tree availability. Recall that the GBA ratio is the ratio of Total Stand Basal Area to GBA, where GBA is the carrying capacity metric linked to controlling MPB attack. Using the GBA ratio, Figure 1.4 indicates that approximately 86% of the plots in the study area are above carrying capacity. The percentage of plots attacked by MPB is higher for those stands that are above carrying capacity than for those plots that are below carrying capacity. Sixty nine percent of the plots that are above carrying capacity have been attacked by MPB whereas approximately forty percent of the plots that are below carrying capacity have been attacked. Of the plots that have been attacked, 46% of those above carrying capacity and 42% of those below carrying capacity have been attacked since 2000. Overall, 46% of all attacks over the 25 year period have occurred since 2000.
The GBA ratio is a significant predictor for 1980-1999 and for 2000-2004. As a single variable, the GBA ratio explains 6.1% of the deviance for 1980-1999 and 5.2% of the deviance for 2000-2004. In the past, stands of a particular basal area, density, size class, or age were considered at risk of MPB attack. These results indicate that stand carrying capacity should also be taken into account when prescribing treatments aimed at mitigating MPB impacts, particularly during drier, hotter climatic conditions such as we have experienced since 2000.
 |
Perhaps the most profound realization emerging from the study is that the historically accurate predictors of MPB susceptibility, basal area and stand density, are no longer significant predictors of MPB attack after 2000. These results, combined with the significance of the GBA ratio, call into question our historical approach of thinning to a prescribed basal area (usually 120 -150 ft2/acre), or density target, as a panacea for preventing MPB attack. If density and basal area are no longer reliable predictors, controlling density and basal area within historically prescribed limits is not likely to reduce susceptibility to MPB under current or future climate. As the GBA ratio is a significant predictor under current climate, it suggests that thinning prescriptions aimed at reducing host susceptibility to MPB attack may only be successful if targets for residual stand basal area are below site carrying capacity as measured by GBA.
Because the GBA response curve (Figure I.3 - Introductory section) is relatively flat for lodgepole pine, it was expected that stand and climate variables would be better predictors of MPB attack on LP pine stands than carrying capacity. The fact that the GBA ratio is a significant variable for predicting MPB attack in LP suggests that carrying capacity has either reached a threshold simultaneously across a large number of stands or that post 2000 climate conditions are sufficiently different from prior years to dramatically change the relationships between the three sides of the MPB susceptibility triangle (Figure I.1 – Introductory Section).
The exploratory data analysis suggested that the dramatic increase in MPB attacks in LP since 2000 were correlated with weather variables that were not directly accounted for in this analysis. The significance of the GBA ratio as a predictor is likely correlated with changes in climate parameters that appear to be driving the large MPB outbreaks since 2000. Likewise, the inclusion of crown ratio (CR) as a predictor since 2000 suggests that tree vigor is playing a much more significant role than it did prior to 2000. While the predictive equation for GBA explains only 11.7% of the variance found in the data, the predictors themselves provide some sense of how GBA may change under a changing climate regime. GBA is positively correlated to summer VPD and pre-growing season precipitation, but negatively correlated to fall VPD, latitude, and the number of days where VPD exceeds 1.5 kPa. These correlations suggest that at the latitudes in this study area, lodgepole growth is most influenced by heat in summer and autumn, and less so by pre-growing season precipitation. GBA is positively influenced by the increasing temperatures associated with increasing summer VPD, but only up to a point. The number of days that VPD exceeds 1.5 kPa reduces growth as do higher VPD values in the autumn. Latitude is also negatively correlated with GBA, which may be related to the reduced summer heat at more northerly latitudes. These LP GBA correlations to heat and pre-growing season precipitation are similar to the presence/absence predictors found for LP by McKenzie at al. (2003).
Answering the question ‘What site specific criteria should drive thinning?’ includes not only considerations of carrying capacity, but also elevation, and slope position. The inclusion of slope position as a criterion is intuitive because slope position is related to carrying capacity at the micro-site level. The inclusion of elevation is less intuitive, but also profound, because it is linked to changes in climate parameters that have emerged in part two of this study.
While carrying capacity plays a role in host susceptibility, the question arises: what is the carrying capacity of a site that is undergoing erratic and dramatic shifts in weather patterns? GBA estimation relied on average historical climate as an input variable because all the plots were measured prior to the recent onset of a multi-year drought. Hall (1989) does acknowledge that GBA appears to be nominally affected by short term climate trends such as the ten year drought of the 1930s. How GBA might change as a result of the current multi-year drought or longer term climate change is not clear, but some growth impact can be expected.
Conclusions
I set out to answer the question: “What role does the relationship between stand and site variables play in host susceptibility to MPB?” Unlike other studies that have identified only stand variables as precursors to increased host susceptibility to MPB attack, this study identifies the GBA ratio as a key predictor of host susceptibility. Moreover, since 2000 the GBA ratio has continued to be a significant predictor, whereas stand basal area and density are no longer significant. While Powell (1999) and Cochran et al. (1994) suggest stocking levels for ponderosa and lodgepole pine that may reduce the incidence of MPB attack, those stocking levels must be adjusted by the GBA in order to obtain any measure of reduced risk. After 2000, measuring host susceptibility based on metrics such as stand density index (SDI) (Reineke, 1933), and relative density (RD) (Curtis, 1982) fails to account for the fact that density and basal area are no longer predictors of MPB attack. Stand carrying capacity adds to our understanding of appropriate density and basal area targets that would ensure treatments are successful regardless of where they are applied on the landscape. In effect, climate change has rewritten our approach to managing host susceptibility based on stand metrics alone.
Chapter 2: Climate Change Impacts in Lodgepole Pine Stands of Eastern Washington National Forests
Introduction
Research on the impacts of climate change on forested ecosystems suggests that disturbance events such as fires and insect outbreaks will be the primary drivers of ecosystem change in the Pacific Northwest (PNW) Region (Gedalof et al. 2005, McKenzie et al. 2004). Large disturbance events may have substantial implications for long term ecological integrity and sustainability at stand, landscape, regional, and global levels. To ensure sustainability of forested systems in the face of climate change requires that we understand how climate might exacerbate disturbance cycles and how we might mitigate extreme events.
To explore the dynamics of extreme disturbance events, I use the example of the insect/host relationship between the Mountain Pine Beetle (Dendroctonus ponderosae Hopkins) (MPB) and one of its major hosts, lodgepole pine (Pinus contorta Dougl. var latifolia Engelm) (LP). My research focuses on host susceptibility as a function of site, stand, and climate variables. By segregating these variables we can estimate the impacts of climate change on the relative stability of the insect/host system, thereby providing a useful tool for predicting how MPB disturbance will change as climate changes.
Eastern Washington forests are increasingly impacted by insect outbreaks and in recent years, extensive MPB outbreaks have been noted in both managed and unmanaged forests throughout the region (www.fs.fed.us/r6/nr/fid/data.shtml). The MPB attacks all native pines in western North America, but historically has had its greatest impact on mature lodgepole pine and ponderosa pine (Pinus ponderosa Laws) (PP). The current MPB outbreak in eastern Washington is predominantly in lodgepole pine, but impacts in ponderosa pine have also increased in recent years. Climate change has been implicated in the massive mountain pine beetle epidemic in lodgepole pine forests in central British Columbia (BC), Canada, where an estimated 8.7 million hectares were affected in 2005 (www.for.gov.bc.ca/hfp/mountain_pine_beetle). Research done in British Columbia by the Canadian Forest Service (Carroll et al. 2003) found a correlation between increasingly mild winter temperatures and the British Columbia MPB epidemic, thus quantifying what they are calling a ‘range shift’ for the MPB. This range expansion has also been suggested by models of insect phenology and behavior (Logan and Powell 2001). They have modeled the effects of the altered temperature regimes that are expected under most climate change scenarios, and found that predicted temperature increases will permit MPB to expand its range into areas where it had previously been excluded because of severe winter temperatures or lack of synchrony in the number of heat days needed to complete key life processes. Safranyik (1978) found that MPB pupae suffered extensive mortality along the -40 ºC mean annual minimum winter temperature isotherm. These studies have identified key attributes of the MPB that will permit it to exploit previously unexploited territory and host populations under a warming climate.
Shore et al. (1989) identified the need to incorporate beetle population dynamics, climatic estimates, and landscape attributes into a hazard rating system for MPB. Shore and Safranyik (1992) developed a stand susceptibility rating system for lodgepole pine that captures these climate and landscape variables using latitude, longitude, and elevation. Measures of beetle pressure assess risk in their system. Together the risk and susceptibility components constitute the entire hazard rating system. The stand susceptibility portion of the rating system had proven itself applicable for lodgepole pine across a broad geographic range in central British Columbia (Shore et al. 2000). However, the extensive epidemic now occurring in that area suggests that broadly defined weather, climate, and stocking variables may not be sufficient to assess stand susceptibility under a changing climate.
The loss of predictive power in current risk rating systems suggests a gap in our current understanding of MPB dynamics. Studies of MPB impacts under climate change scenarios have focused on the effects of increasing temperatures on MPB survival and reproductive ability (Bentz et al. 1991; Carroll et al. 2003, Logan et al. 2003); but none have explored how climate change may affect host susceptibility in areas that have historically been within the range of MPB activity. In this paper, I identify potential mechanisms for how climate change has affected host susceptibility and led to an increase in successful MPB attacks in eastern Washington forests.
Methods
Aerial Survey Data on Mountain Pine Beetle Attack
Every year the Washington State Department of Natural Resources (DNR) conducts an aerial survey of major insect and disease outbreaks in forested portions of the state (http://www.dnr.wa.gov/htdocs/rp/forhealth). These data are collated by participating states and maintained at the USFS Forest Health Protection branch. Digital maps containing locations and information on the type, intensity, and extent of forest damage were downloaded from the Forest Health Protection site at http://www.fs.fed.us/r6/nr/fid/as/index.shtml for 1980 to 2005. The data were imported into an ARCGIS 9.0 database and queried to identify all polygons in eastern Washington where MPB had attacked either ponderosa pine (PP) or lodgepole pine (LP) over the 26 year period. The aerial survey captures MPB ‘red attack’ – when the tree’s needles turn red in the year following successful MPB attack. By correcting aerial survey estimates of attack to reflect the year mortality occurred it is possible to link MPB attack, forest attributes, and climate data. Figure 2.1 shows time series data on ponderosa pine (PP) and lodgepole pine (LP), giving the mortality and mortality/acre by year across national forests in eastern Washington. Based on the survey data, the average mortality rate on national forests for 1979-1999 (1980-2000 reporting period) is 2.8 trees per acre (TPA) for LP and 0.7 TPA for PP; for 2000-2004 (2001-2005 reporting period) the average tree per acre mortality increased to 9.5 for LP and 2.6 TPA for PP.
Correlations between total acreage attacked and average polygon size show that prior to 2000, MPB outbreaks were concentrated in a few large patches. Since 2000, although total mortality is climbing, the average polygon size has not increased. Rather, MPB attack is dispersed throughout the forest. This shift from concentrations of MPB attack to widespread attack suggests that the combination of increased temperatures and reduced moisture are creating conditions where stands that were somewhat resistant to MPB prior to 2000 are now susceptible. Information from the data survey crew (Moore, 2006) concurs with this idea that MPB attack is making a broader ecological footprint that it has in the past, but also indicates that improved technology has become available, starting in 2003, which improves the accuracy at capturing small polygons thereby reducing the average polygon size.
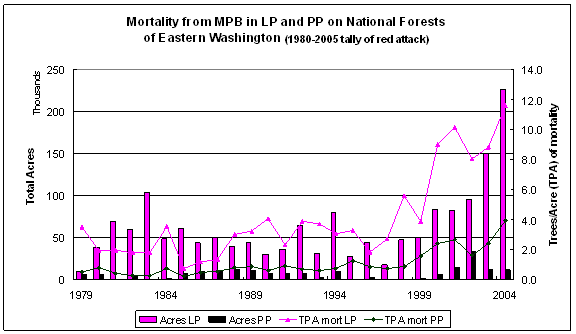 |
Figure 2.1: Mortality from MPB on Eastern Washington National Forests |
Inventory Data
Site and stand characteristics of LP and PP forests in Eastern Washington were obtained from National Forest Continuous Vegetation Survey (CVS) plots. This CVS dataset is collected on a 1.7 mile grid covering all national forests in the region. A subset of CVS plots containing pine species (either LP or PP) was identified as the core sample for this analysis. Of 2243 CVS plots, approximately 1770 have a pine component that is within the size and age class that is susceptible to MPB attack. From Figure 2.1, it is clear that the majority of the increase in MPB activity on National Forests is in lodgepole pine. Thus, this study focuses on the dynamics of MPB activity in lodgepole pine on national forests. Of the 1770 CVS plots with susceptible pine, 574 have a LP pine component with growth data sufficient to determine site carrying capacity (see Chapter 1). Of the 574 LP plots, 218 unique plots have been attacked by MPB a total of 421 times from 1980-2003. In 2004, an additional 81 plots were attacked, but there is no plot specific climate data to assess climate interactions for these data.
Of the 574 plots, 397 plots are located in the Okanogan and Wenatchee National forests. These two forests have experienced 93% of the MPB attacks identified in eastern Washington national forests since 1980, with 189 plots receiving a total of 351 MPB attacks. There are 224 plots with LP in the Colville and 173 plots in the Okanogan National Forest. These 397 plots form the final subset of data used in this analysis. This subset of data was chosen because it had estimates for climate, stand, site, and carrying capacity variables, as well as a high level of MPB attacks from which to infer possible causal relationships between host susceptibility and MPB attack.
Estimators were calculated for each plot (Table 2.1). The inventory data were collected from 1994-2003. Dead trees resulting from MPB attacks that occurred prior to the date(s) of inventory were not included in the live tree tally, but would have formed part of the stand at the time of MPB attack. In order to estimate stand conditions for pre-1994 MPB attacks, these dead trees were included in basal area and density estimates if MPB attack had occurred prior to the inventory date. However, only those trees that had died in the five years prior to the date of inventory were included in the estimate, as the inventory measurement guidelines did not provide sufficient detail to determine the reason and time of death for trees that had died earlier. Some of the plots that had been measured in the early years were re-measured in later periods. Stand attributes from the second inventory were used as the best estimate of stand competition during that attack for those plots that were attacked after the latest measurement period.
| Table 2.1: Site and stand variables for each plot |
 |
General Climate Trends
Using data from the Western Regional Climate Center (http://www.wrcc.dri.edu), average monthly values for temperature and precipitation were plotted for the East Cascades (06) and northeast Washington climate divisions (09) for the entire period of record (1895-2006). For comparison to the long term record, additional plots were added, using the subset of records for the 1979-1999 period corresponding to the era of more or less endemic MPB activity reported in the aerial survey, and for 2000-2004 when MPB mortality is escalating. Figure 2.2 gives the East Cascades trends for all three time periods of interest; similar trends appear for the northeast Washington climate division. June through Sept and December through February were slightly warmer in the period corresponding to MPB outbreak in 2000-2004 but not significantly different from 1979-1999.
However, the region wide temperature and precipitation trends for the East Cascades and Northeast Washington Climate Divisions suggest several groups of variables that may have predictive power on an individual plot basis. The areas in Figure 2.2 where there is variance from the long term average suggest that winter (Nov-Mar) moisture, winter (Dec-Mar) temperature, and summer (June-Sept) temperature may yield fruitful predictors of the effects of climate variability on MPB impacts in LP. Although average summer temperature is not significantly higher for the period of extensive MPB outbreak, the vapor pressure deficit (VPD) is exponentially related to temperature, therefore small increases in temperature result in large increases in VPD. VPD is closely linked to physiological parameters that drive tree growth (Waring and Running 1998). Once VPD is sufficient to shut down transpiration (Warkentin et al., 1992), it was hypothesized that there would be reduced resistance to MPB attack because the pitching response necessary for tree defense (Wilkens et al 1998), and the production of defensive chemicals (Raffa and Berryman 1983), or both, would be compromised.
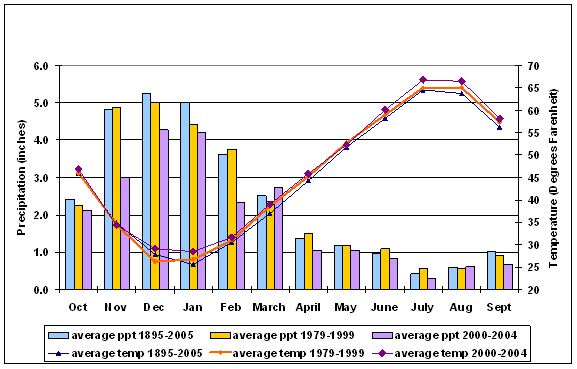 |
Figure 2.2: Average temperature and precipitation trends for the East Cascades Climate Division (06) |
According to Waring and Running (1998), most conifer forests begin to reduce stomatal conductance at a VPD of approximately 750 Pa and have completely ceased transpiration at a VPD of 3000 Pa. Waring and Schlesinger (1985) indicate that an exponential decline in conductance occurs in a wide range of species starting at a VPD of 1000 Pa up to 2000 Pa. According to Delucia et al. (2000), pine species show a consistent decline in the ratio of leaf area (A l) to sapwood cross sectional area (As) in response to increasing average summer VPD for the months of June to August. The links between VPD and tree physiological response suggest that estimates of this parameter would yield useful insights into climate impacts on the MPB-host dynamic.
As part of the exploratory data analysis, acres of MPB attack and the five-year running average of summer temperature were compared (Figure 2.3) to determine if there were correlations between the two variables. The sharp increase in the five-year average temperature for northeastern Washington in the early 1980s corresponds to a large outbreak of MPB in PP in that area. However, most of the mortality in PP was situated off national forest lands and thus does not form part of this analysis. Since the 1980s, five-year running average temperatures in Northeastern Washington did not surpass the 1989 peak until 2005. In contrast, 2003 and 2004 marked the peak in five-year running average summer temperatures in the East Cascades, and correspond to a substantial increase in mortality in that area. Given these trends between regional average temperature, VPD, and MPB outbreaks, I modeled MPB impacts as a function of these site specific climate variables.
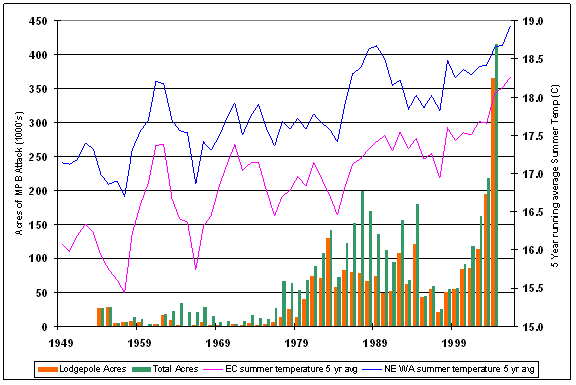 |
Figure 2.3: Summer temperatures and MPB attack in Lodgepole and Ponderosa Pine of Eastern Washington |
Site Specific Climate Data
Interpolation of climate station data is needed to adjust for changes in weather parameters over the substantial range of terrain, slope, aspect, and elevation at which MPB outbreaks occur. Various solutions to the weather interpolation issue in complex terrain have been proposed (e.g. Daly et al. 1994, Thornton et al. 1997, Yeh et al. 2000). A review of the methods (Daly 2006) indicates strengths and weaknesses in all methods, with the more complicated methods being able to account for elements such as elevation gradient, rain shadows, cold air drainage, and temperature inversions. For this study the DAYMET model (Thornton et al. 1997) was chosen to estimate site specific climate variables as it is readily available for Eastern Washington, requires no climatological experience to configure or evaluate, and accounts for the elevation and rain-shadow gradients within the study area. The DAYMET data are available in tabular form as daily weather observations on a 1 km2 grid size for 1980 to 2003. The DAYMET dataset is held at the Climate and Global Dynamics Division of the National Center for Atmospheric Research in Boulder Colorado and is available at www.daymet.org. The tabular data form includes estimates of maximum, minimum, and daily average temperature, precipitation, vapor pressure deficit, solar radiation, and day length.
To obtain DAYMET data, all susceptible pine plots were added to an ArcGIS database and transformed from UTM coordinates to decimal degrees. Using these data, a WGET (http://www.gnu.org/software/wget/) program was created to automatically download the daily climate data for all plots. Additional transformations were run using Python ™ scripts to link plot coordinates to inventory plot number and integrate the data into a single Access database. Across all National Forests, there are 466 plots within polygons identified by aerial surveys as impacted by MPB over a 25 year period from 1980-2005 (i.e. attack years from 1979-2004). The 466 plots have been ‘attacked’ (i.e. located within a MPB polygon) a total of 776 times, of which 81 attacks occurred in 2004 (2005 aerial tally) and 8 attacks occurred in 1979 (1980 aerial tally). These 89 attacks are outside the window for point specific DAYMET daily weather data and are not included in the analysis of climate impacts on MPB activity. An additional six attacks from 1980 have been excluded because pre-growing season precipitation could not be calculated. Of the 466 plots, 167 have been attacked multiple times according to aerial flight surveys. The DAYMET daily weather data from 1980 to 2003, covering the entire range of susceptible plots including the 466 MPB hit plots in the CVS dataset, were loaded into an Access ™ database. Approximately 14 million daily weather records were compiled. This database was refined to include only those plots and attacks that occurred in the Okanogan and Colville National Forests, for a total of 351 attacks on 189 unique plots out of a total of 397 plots.
The DAYMET data were summarized by plot into seasonable weather variables that might be of predictive value for estimating climate impacts on MPB success. Using the western regional climate center summaries as a guide, values for each plot were calculated for summer parameters and winter parameters for each year (both growing season and water year) in order to discern the potential moisture stress for a given plot in a given year. Calculated variables are identified in Table 2.2.
The summer parameters include the number of days in which temperature exceeds the minimum for MPB flight, and the average temperature of those days, the number of days where VPD exceeds 1000 Pa (onset of moisture stress) and 2000 Pa (moisture stress sufficient for stomatal closure), and the average VPD for each period. The start dates of the temperature and moisture stress by year are also calculated for the summer variables. In the absence of soil moisture and soil moisture holding capacity data for each plot, it was hypothesized that the date when the atmospheric conditions are sufficient to induce moisture stress may have predictive power in linking the start of evaporative demand to the end of freezing temperatures (start of snowmelt).
In eastern Washington, general climate trends suggest that cold winter temperatures have not played a significant role in controlling MPB activity, as was the case in central BC prior to this recent warming trend. Analysis of site-specific winter data indicates that there were virtually no winter minimum temperatures < -40 C, which would cause MPB populations to crash as was the historical case in central British Columbia. What then historically controlled the dynamics between MPB and lodgepole pine in eastern Washington forests? And how might climate change alter the dynamic equilibrium between MPB and lodgepole pine in eastern Washington?
Potentially useful winter measurements are cumulative water balance at the end of the winter moisture accumulating period, and the time period between accumulation and onset of moisture stress during the summer months. As a surrogate for water balance, I calculate total precipitation, pre-growing season precipitation (September of prior year to May of attack year), number of days between last frost and onset of temperatures >15.5 ºC and VPD > 1000 Pa were calculated for each combination of plot and water year.
| Table 2.2: Climate Factors generated from DAYMET daily point data |
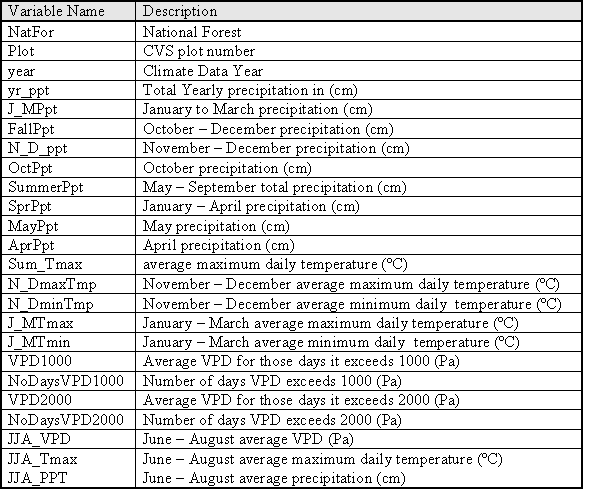 |
Integrating the Data Sets
To link the aerial survey trend data to forest inventory, CVS plot locations were imported into ArcGIS 9.0 and overlain on annual survey data. Plot coordinates, biophysical characteristics, and MPB hit statistics were collected for each year of the survey. The MPB hit plots were then linked back into an Access ™ database with inventory data for all available plots. Because of the perceived importance of pre-growing season moisture (precipitation from September to December of the prior year), data on 1980 attacks were eliminated from the analysis because there were no estimates of 1979 autumn precipitation levels. The remaining plot-specific climate variables covering the 23 full years of data available from DAYMET were concatenated with plot variables and MPB attack statistics in an Access ™ database.
The databases were exported to the R statistical package (http://cran.r-project.org) for both exploratory data analysis and to conduct statistical tests. The correlation between climate variables and MPB attack levels in the 1980-1999 period (hereafter referred to as ‘pre-2000’) and from 2000-2003 (hereafter referred to as ‘2000+’) suggested that tests that separated these two time periods would yield the most insight into climate impacts on the dynamic equilibrium between MPB and its host species.
Assessment Techniques
Those plots identified as “MPB hits’ because they overlapped with MPB infestations as identified by the aerial flight survey were coded as [1] for the year that they are attacked. Those that were not attacked were coded as [0]. Logistic regression is a standard approach in determining predictors for binary data. A generalized linear model (glm) of the binomial family (GLM-B) can therefore be used to determine relationships between MPB activity [hit=1, not hit=0] and the climate, site, and stand variables of interest. Using the GLM-B, one approach is to fit a full model with all variables and then conduct a stepwise deletion of the least significant variable until any further deletions fail to improve the model according to whatever criterion is chosen (Chambers and Hastie 1992, Becker 1988 and others). Cox and Wermuth (1992) indicate GLM-B’s are only appropriate when at least 20% of the population is either a [0] or a [1]. Predictions will be biased for datasets with a very high number of zeros (Cox and Snell (1989) as cited in Cox and Wermuth (1992)), because the models will have a high success rate at predicting the zeros, but a low success rate of predicting the ones.
MPB attack statistics [0, 1] were combined with the DAYMET Climate data for the twenty four years of available climate data (Table 2.3) for all national forests in the study area. Table 2.3 indicates that the data spread does not meet the minimum distribution requirements for a GLM-B. Examination of MPB attack data indicates that 93% of the recorded MPB attacks have occurred in the Colville and Okanogan National Forests. However, even in those instances, the data sets have a very high number of zeros (Table 2.4).
Approaches that account for large numbers of zeros are called zero-inflated models and are now common in ecology (Martin et al. 2005, Warton, 2005). Zero-inflated negative binomial (ZINB) and zero inflated Poisson (ZIP) regressions have been found to improve the fit of statistical models in a number of ecological and other studies (Lambert 1992, Welsh et al. 1996, Hall 2000, Lee et al. 2005, Martin et al. 2005, Warton 2005). These approaches were therefore examined for their potential in determining the relationships between MPB attack and climatic variables.
| Table 2. 3: Distribution of climate x MPB attack by year for all National Forests |
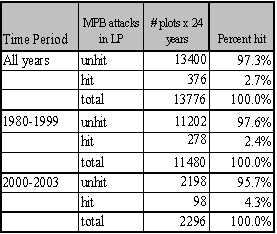 |
| Table 2.4: Distribution of climate x MPB attack on the Colville and Okanogan National Forests only |
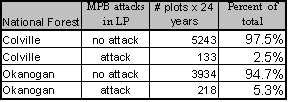 |
Martin et al. (2005) suggest that zero inflated data may arise from two conditions: one in which the zeros are ‘true zeros’ arising from ecological processes whereby species, such as MPB, are not present across their entire potential habitat, and ‘false zeros’, where measurement errors fail to capture the presence of the species. Based on these definitions, the zero-inflated data set on MPB attacks reflects a true zero condition. If it were a false zero condition, susceptible pine would be present on the landscape only rarely because MPB attack would continuously remove these susceptible stands.
For data sets with true zeros, conditional models can be used to evaluate the underlying relationships (Lambert 1992, Welsh et al. 1996, Martin et al. 2005). This modeling approach segregates the data into two parts so that prediction of occurrence, [0, 1], has separate parameter estimates from predictions of counts (# attacks) for areas where MPB is present. The methods use a combination of GLM-B to predict MPB attack, and then use a ZINB model to analyze parameters for the non-zero part of the dataset. Conditional models separate the zero from the non-zero component and analyze each separately (Fletcher et al. 2005), in order to arrive at inferences for each condition.
The GLM-B uses binomial data to determine relationships between yearly weather conditions and MPB attack in a given year. However, year to year variability in climate factors can obscure longer term climate trends. In order to search for relationships between MPB attack and longer term climate trends, the data were aggregated as outlined in Table 2.5. Climate variables were averaged by the pre-2000 and 2000+ time periods in order to determine if longer term climate trends were substantially influencing MPB attack outcomes. Two Poisson family models were used for the tests of significance, a generalized linear model of the Poisson family (GLM-P) and the zero-inflated Poisson (ZIP). For the pre-2000 period, approximately 33% of the plots are non-zero and 67% zero. For the 2000+ period, the ratio of [0, 1] is approximately [0.84:0.16].
I report on the conditional model results using two methods. I use the GLM-B to determine predictors for presence/absence on a yearly basis and then analyzed the non-zero component using ZINB tests to determine differences in the predictor variables for each part of the binomial distribution. For the GLM-P and ZIP tests, I combined the data into two components: 1) those plots that were never hit and 2) a count of those plots that were hit one or more times. The dataset was combined in this way to ascertain the cumulative impact of climate on MPB attack. The combined [0, count] data were modeled using a GLM-P for the 1980-1999 and 2000-2003 periods. The ZIP model was used to improve predictor estimates for the 2000-2003 data only. Analyses of the zero-inflated data, whether in the ZINB or ZIP format, were conducted using the R statistical package “zicounts” (http://cran.r-project.org/).
| Table 2. 5: Count data on MPB attacks by time period |
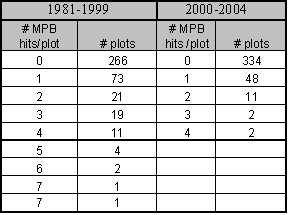 |
Assessments of ‘best fit’ used the Akaike Information Criterion (AIC) score (Akaike, 1973), rather than R2. The AIC is calculated by:
AIC = 2k – 2 ln L
Where k is the number of parameters and L is the likelihood function . The AIC with the lowest value corresponds to the model with the best fit. The AIC is designed to promote parsimony in the model selection process, as over-fitting the model is penalized with an increase in the score. However, with a large number of data points such as I have, the model with the lowest AIC score sometimes included non-significant variables. To eliminate the non-significant variables and still have a ‘best fit’ model I dropped the non-significant variables one at a time, starting with the least significant one. I continued that procedure until all the variables were significant or I had increased the AIC by no more than 2. Keeping the AIC difference within 2 is supported by work by Burnham and Anderson (2002). Burnham and Anderson (2002) proposed a technique for determining relative model strength called the ΔAIC (Delta AIC). The ΔAIC determines if another model within the hierarchy of nested models might fit the data equally as well as the ‘best model’. A ΔAIC difference of <=2 between the models suggests that the alternate model may be equally effective in explaining the relationships between predictor and response variables with a new dataset. A ΔAIC difference of 3 to 7 suggests that the alternate model is not well supported. A ΔAIC difference of >10 suggests that the alternate model is a highly unlikely alternative. By dropping non-significant variables and maintaining the AIC within 2 points of the lowest AIC, I was able to develop more parsimonious models that considered additional information about the relationships between the variables in each model. Using this procedure, I was also able to ensure that all variable coefficients were significantly different from zero at a level of 0.05 or less.
A second estimator of ‘best fit’ is Percent Deviance Explained ((PDE). For each additional variable added in the GLM-B or GLM-P procedure, R calculates the amount of additional deviance explained and returns both total deviance explained and residual (unexplained) deviance. The PDE is given by (1- (residual deviance/null deviance)). The model with the highest PDE gives the lowest AIC. The AIC score was used to determine which model was the best fit, the ΔAIC was used to remove non-significant variables if necessary, and the PDE was used to determine how much variability had been explained.
Results
Table 2.5 shows that for the twenty year period prior to 2000, 33% of the plots were hit at least once. In the 2000-2003 time period 16% of the plots were attacked at least once. This change in attack rate is equivalent to an increase from 1.65% of the plots attacked per year to 4% of the plots attacked per year. There is also a shift in the ratio of plots hit at higher elevations since 2000. Table 2.6 indicates that MPB attacks since 2000 have been increasing at higher elevations and staying relatively stable at lower elevations. Below approximately 5000 feet in elevation, the percentage of attacked plots has remained stable across the two time periods despite a substantial increase in overall mortality rates. The increased tree mortality rates after 2000 are reflected by the more than doubling of the number of plots hit per year for elevations above 5000 feet. By virtue of the small sample size above 7000 feet, the increase there is by 1/3, or less than the increase occurring between 5000 and 7000 feet in elevation.
| Table 2. 6: Distribution of attacks by elevation across all years |
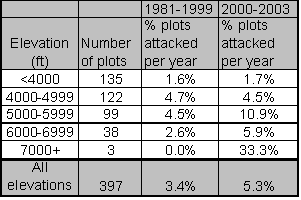 |
Part one of the conditional model (GLM-B)
In order to assess the relative predictive strength of climate influence on host susceptibility, the first part of the conditional model was set up to distinguish stand, site, and climate variables separately. To model attack versus non-attack, the GLM-B was built within the R statistical package. A full model was fit using all variables. Backward elimination was used to fit the model. Identical procedures were used in the pre-2000 and 2000+ time periods to fit models with all climate, site, and stand variables, and ‘climate only” models, in order to estimate the contribution made by climate, and stand and site predictors, independently.
Once the model with the lowest AIC score was determined, PDE was determined for each time period and variable type combination. The model coefficients and PDE by time period and variable combination are given in Table 2.7. Table 2.7 indicate that for 2000+, climate parameters explain approximately twice the amount of deviance that they can explain in the pre-2000 period. Including stand and site variables increased the PDE by 3.1% prior to 2000 and by 3.2% after 2000. Climate accounts for 82% of the explainable variation after 2000, and 69% of the explainable variation prior to 2000.
| Table 2. 7: Significant predictors for the GLM-B model |
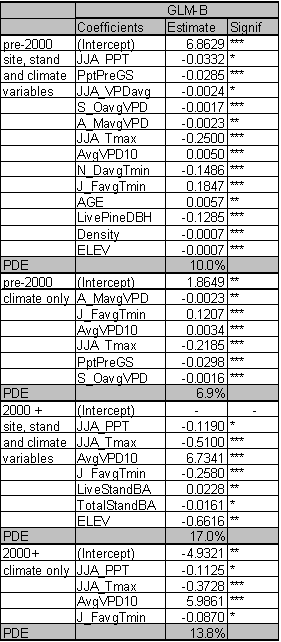 |
Part two of the conditional model (ZINB)
Using the significant variables determined from the GLM-B, I fit the ZINB models to their respective data sets for the pre-2000 and 2000+ time periods. I used the default parameters in the R statistical package ‘ZICOUNTS’ to run the tests. The zero and non-zero components of the model were initially fitted with the same variables. Any non-significant variables in the non-zero component of the model were removed one at a time, starting with the least significant variable, until all variables were significant at 0.05 or greater. In cases where the models produced unstable covariance matrices, I removed collinear predictor variables from the non-zero part of the model until stability was achieved. If removing collinear variables did not produce a stable covariance matrix, I added variables to the non-zero part of the model based on prior knowledge of their importance in predicting MPB attack. The results for the ZINB models for the pre-2000 and 2000+ periods are provided in Table 2.8.
Only eight ZINB variables appear in the GLM-B out of thirteen possible variables in the pre-2000 period. The association between the zero and non-zero components is even weaker for the 2000+ period, where only two variables are the same between the two models. The large zero-inflation is likely responsible for the difference in predictors between these periods.
| Table 2. 8: Predictors for the non-zero component of the ZINB model |
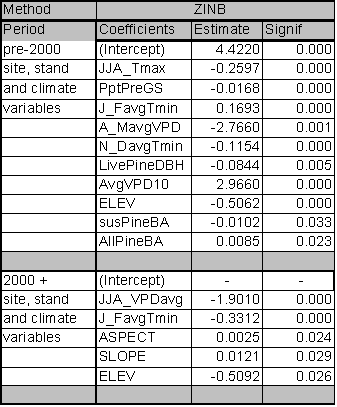 |
Multi-Year Analysis
The GLM-P results that test average trends over the two time periods (Table 2.9), explain from 2.6 to 4.2 times more deviance than can be explained from GLM-B tests that look at yearly climate variables. After 2000, climate and site variables are significant predictors of MPB attack whereas stand variables no longer provide predictive power.
| Table 2. 9: Significant predictors for GLM-P model |
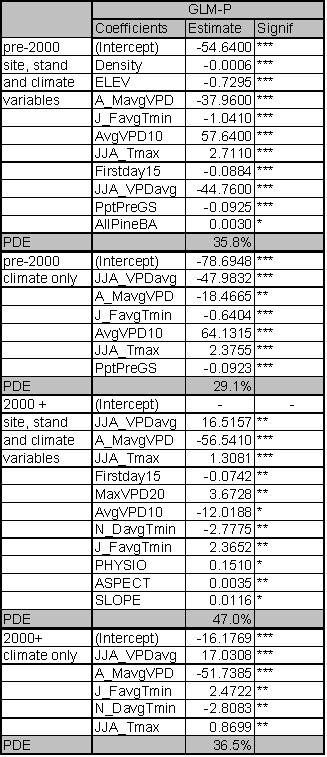 |
Using the GLM-P predictors as a basis, I ran a ZIP model for both periods to ascertain if there was any bias in the GLM-P results from zero inflation. The ZIP analysis indicates that the non-zero component of the Poisson models are well represented in the GLM-P models as all significant variables for the non-zero component also appear in the GLM-P models.
| Table 2.10: Significant predictors for the non-zero component of the ZIP model |
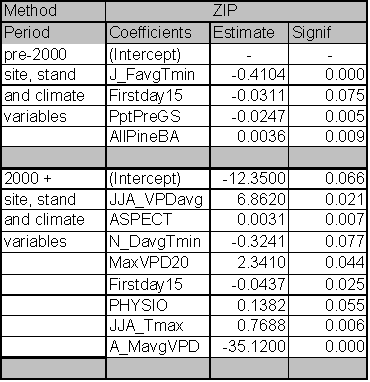 |
Discussion
From the exploratory data analysis, and our current understanding of MPB dynamics in lodgepole pine, it was expected that there would be two emergent themes from this research. Firstly, I expected that tree moisture stress, as affected by precipitation, winter temperatures, and stocking levels, would drive MPB attack. All of these variables were significant predictors for MPB attacked sites in the pre-2000 period. However, from 2000 forward, stocking and precipitation variables are not significant predictors. Although winter temperatures are correlated with growing season moisture availability, precipitation itself is not a predictor in the post 2000 period. Secondly, because tree physiological response is closely linked to summer VPD (Warkentin et al. 1992, Delucia et al. 2000), it was expected that VPD and/or temperature would be significant predictors with increasing summer temperatures. This second expectation was met as the increase in summer VPD for the 2000+ period has a strong correlation to MPB attack. The correlation between summer temperature and MPB attack is less prominent in the pre-2000 data, as we would expect given that average temperatures were lower than they were after 2000.
To place the results in the context of regional climate, I plotted long term precipitation and temperature averages for the entire region (Figure 2.4). The regional climate trends show that the only other time in the historical record where the five year average of precipitation has been as low as it was in the past few years, was during the 1920s. Figure 2.4 also shows that at no time in the historical record did the regional five year average of summer temperatures exceeded 18.0ºC prior to 1999, except for a single year, 1989. As with other time periods, when temperature was up relative to short term averages, and precipitation levels were down, MPB activity increased substantially in the 1980s and since 2000. From Figure 2.3,which segregates the shift in temperature into two sub-regions that capture location differences, it appears that the temperature shift is largely responsible for the most recent MPB outbreaks in both the 1980s, in ponderosa pine at low elevations in northeastern Washington, and since 2000, in mid-elevation lodgepole pine in the East Cascades region. What is more critical since 2000 is that the magnitude of the increase in MPB activity and the magnitude of the temperature increase have never been greater within the period of recorded weather monitoring.
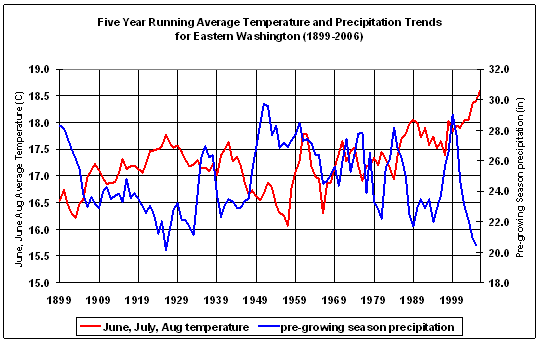 |
| Figure 2.4: Average summer temperature and pre-growing season precipitation (Sept – through Aug) for eastern Washington 1899-2006 |
Themes emerging from analysis of part one of the conditional model
For both time frames under investigation the key climate predictors linked to the presence or absence of MPB attacks are essentially equivalent. Minor differences are centered on the inclusion of spring and autumn VPD parameters prior to 2000. Although these differences in estimation may not be significant, they do suggest that increased VPD is playing a greater role than it has done in the past in perpetuating successful MPB attacks. The doubling in the amount of deviance explained by climate predictors in the years since 2000, and the reduction in the number of significant stand parameters in the same period suggests that climate variables have taken precedence over stand variables as major predictors of MPB attack in the years since 2000.
By including stand and site parameters, PDE increases by approximately one third, suggesting that climate is a better predictor than stand and site variables in determining the outcome of MPB attack regardless of time period. In the 2000+ period, basal area is the only significant stocking level predictor. In contrast, the pre-2000 period includes age, diameter, and density as significant stand and stocking predictors. This change in the relative value of various stand parameters as predictors may presage a fundamental shift in the interaction between the host and insect. It has certainly altered the predictive equation for successful MPB attack substantially.
Themes emerging from analysis of part two of the conditional model
By segregating the data into its zero-inflated and non-zero components, it is possible to identify which variables are most relevant for the non-zero components (MPB attacked stands). In the pre-2000 period, pre-growing season precipitation, minimum winter temperatures, and pine basal area are significant predictors, whereas in 2000+, summer VPD, aspect, and winter minimum temperatures are the only significant predictors. Only average VPD remains as a significant climate predictor on its own, a result that is congruent with our understanding that drier summers often result in more MPB attack. Increases in pre-growing season precipitation reduce the likelihood of MPB attack. Warmer January and February temperatures increase the likelihood of attack because they are likely to reduce snow pack at the end of the season, and thus reduce moisture availability moving into the growing season.
Figure 2.4 suggests one probable cause for the changes in significant coefficients across time periods and across elevation bands. While temperature has been generally increasing across the entire period from 1980 to present, the variation in moisture availability in the pre-2000 period may have obscured the significance that climate trends played in successful MPB attack during that period. However, as stand and site variables were significant predictors in the pre-2000 period under all estimation procedures, it is likely that site and stand components played a much larger role in MPB attack prior to 2000. The significance of winter temperature variables across all time periods is likely due to their effect on snow pack levels, rather than their potential for inducing mortality in MPB pupae. The minimum temperature regimes of even the highest elevation plots in the data set do not support the idea that winter temperature is controlling MPB survival in eastern Washington.
That summer maximum temperature is negatively correlated with MPB attack in the ZINB analysis is a result of interaction with average VPD when it is > 1.0 kPa. For the post-2000 period, summer VPD is negatively correlated with MPB attack in the ZINB analysis. The negative correlation may reflect the trend toward attacks at higher elevations that should have lower summer VPD. If we simply measure temperature, the relationship between MPB attack and climate is not necessarily discernible because all stands and indeed all plots experience the ‘hot’ summers that are a feature of eastern Washington climate. Differences in the sign of summer temperature and VPD variables imply that it isn’t heat that is controlling host susceptibility to MPB attack, but relative dryness. That result is consistent with knowledge of tree physiology that indicates that pines can tolerate hot, even desert like, conditions but that they must acclimate to summer dryness by altering leaf area to sapwood area ratios (Delucia et al. 2000). Changes in summer ‘dryness’ as a result of increased temperature, continually elevated temperatures, or reduced moisture availability would produce the same effect, although only the first two would be captured by the VPD data that are available for this study.
Themes from multi-year analysis techniques
Using the climate averages in the GLM-P tests explains substantially more deviance than using yearly weather variables. An increase from 17% to 47% of the deviance is explained in the 2000+ period. In the pre-2000 period, the PDE went from 10% to 35.8% when using the average weather values as explanatory variables. Some of the increase in explanatory power resides in the significant predictors available for the GLM-P and ZIP analysis that were not usable in the binomial analysis because they contained missing observations. Specifically, VPD predictors for values above 1000 were not present in some plots for all years, but were present in all plots at some point in both time periods.
Variables associated with high VPD values were important predictors in both the GLM-P and ZIP tests. These predictors include the maximum VPD when it exceeds 2.0 kPa (MaxVPD20) for the 2000+ period, and the first day that VPD > 1.5 kPa (Firstday15) for both periods. ZIP tests that look at average climate data indicate that the cumulative effects of climate patterns shown in Figure 2.4 result in noticeable differences in the predictor variables and their sign between time periods. Only the first day where VPD exceeds 1.5 kPa is a significant predictor in both time periods. Winter temperature is also significant for both periods, but the Nov-Dec period is significant after 2000 and the Jan-Feb period is significant in 1980-1999. There are no significant stand level variables after 2000.
The ZIP analysis indicates that the average summer VPD for the 2000+ period, extremely high VPD values, and early onset of dry days (negative correlation with Firstday15) are strongly correlated with successful MPB attack. January and February temperatures are positively correlated with attack in the GLM-P tests, while November and December temperatures are negatively correlated with attack in both tests. It is posited that because late winter temperature influences snow pack, a positive correlation equates to reduced snow pack. The negative correlation with November and December temperatures that is associated with the non-zero component of the data set is less clear, but it may relate to the importance of that period, for both tree growth and allocation of the next year’s carbon budget. Research by Kusnierczyk and Ettl (2002) found a positive correlation with ponderosa pine growth and November precipitation in the Okanogan National Forest for stands that occur up to 1,500 m (~5000 feet) in elevation. As many of the affected stands are above 5000 feet, it is possible that the negative correlation for November temperatures reflects similar processes to the positive precipitation correlation found by Kusnierczyk and Ettl (2002) at lower elevations. The positive precipitation correlation would support tree growth and thus increase its resistance to MPB attack that is negatively correlated with November temperatures.
Conclusions
In 2004 alone, MPB affected over 415,000 acres, resulting in over 4 million dead pine trees (red attack observed in 2005) in all forests of eastern Washington. MPB mortality in these two tree species alone equals 55% of the total tree mortality state-wide from all insects, disease, animals, and weather damage. The extent of the MPB outbreak across eastern Washington suggests that the dynamic equilibrium between the insect and lodgepole pine has been fundamentally altered. Although the current understanding of the extensive MPB epidemic in central BC is that climate change is acting through its influence on MPB winter survival, my results suggest that in eastern Washington, summer temperatures and their impact on average VPD are the driving variables affecting host susceptibility. The results from the ZIP analysis also suggest that the current multi-year drought is not as significant a variable as the shift in temperature, and its effects on VPD.
The average summer temperature in the East Cascades was approximately 17ºC in 1999 and 2000 and increased to approximately 19 ºC in 2003 and 2004. Given that the average summer humidity in eastern Washington is approximately 30%, I estimated that average summer VPD is 1.360 kPa at 17ºC and 1.540 kPa at 19ºC. Given the relationship between VPD and temperature (Waring and Running 1998) and the correlation between MPB attack levels and the five year average summer temperature (Figure 2.3 and 2.4), it is possible that a VPD threshold sufficient to limit tree defense mechanisms may exist and has been surpassed in the past five years of extremely hot summers. Pines can live in hotter and drier environments that those of eastern Washington, but the findings of Delucia et al. (2000) suggest that they must acclimate to hotter, drier conditions by altering their ratio of leaf area to sapwood area. The time it takes for pines to respond to a new temperature regime by altering leaf area to sapwood area ratios is not known. The possibility for response to changes in VPD by mature pine is also not known. Shifts in climate toward warmer drier conditions can be expected to exacerbate competitive interactions within the stands by creating additional moisture stress. These results suggest that climate change may also induce a fundamental shift in the ability of the tree to respond because of its inherent physiological limits. This inability to respond physiologically increases the trees susceptibility to MPB regardless of the effect of weather patterns on stand dynamics or on the MPB itself.
Given that the pressure from escalating MPB populations is increasing, even if pines are able to respond to changes in VPD, it is not clear that they will have time to do so prior to MPB attack. For this susceptible species, the physiological response of stomatal closure in the face of increasing temperature occurs at the time when MPB are most likely to be active. Although the increase in MPB populations has been considered as the prime reason for the dramatic increase in MPB induced tree mortality in the recent past, the role of increasing host susceptibility because of climate change can no longer be ignored.
![]()
Summary and Further Research
The substantial increase in MPB mortality since 2000 is consistent with predictions of enhanced disturbance regimes under climate change scenarios. This research identifies two precursors leading to the increase in disturbance: stocking exceeding site carrying capacity and increasing summer VPD affecting tree physiological condition.
Though focused on tree physiological response and not carrying capacity, the relationships between average summer VPD and pine physiological response as reported by Delucia et al. (2000) reveal interesting trends that will affect both stand and individual tree response to climate change. According to Delucia et al (2000), pine species show a consistent decline in the ratio of leaf area (Al) to sapwood cross sectional area (As) in response to increasing average summer VPD for the months of June to August. Furthermore, they suggest that the link between climate and Al/As is perhaps more dynamic for pines than for other tree species of western forests. Analysis of physiological response suggests that pines acclimate to experienced average VPD by modulating the amount of leaf area they carry. The implications of the Delucia et al. (2000) study are substantial, as numerous studies have attempted to correlate leaf area to productivity, carrying capacity, and vigor indices in order to explain susceptibility to MPB (Waring and Pitman 1983, Amman 1972, Mitchell et al. 1991, Larsson et al. 1983, Waring et al 1980, and others). Declines in the leaf area/sapwood area ratio in response to climate change would have to occur by reducing leaf area or increasing sapwood. Either of these conditions would affect the tree growth rates and hence impact GBA.
To determine if average summer VPD changes in recent years are large enough to potentially alter carrying capacity, DAYMET data (Thornton et al. 1997) were used to calculate yearly averages of VPD for June through August for the entire susceptible pine dataset. The yearly VPD values were then averaged for 1980-1999 and 2000-2003. The data were segregated by national forest to assess regional effects. For each susceptible pine plot, the VPD values for the two periods were calculated and plotted in Figure S.1. Figure S.1 indicates that regardless of the average summer VPD in 1980-1999, there was an increase for the 2000-2003 period. Trend lines indicate that the increase is consistent across all VPD ranges suggesting that the impact of increased VPD would occur at all elevations. The greatest increase in VPD was in the Okanogan and Colville National Forests. In those two national forests, average summer VPD for pine that was accustomed to a VPD of 2.0 kPa increased by .43 kPa.
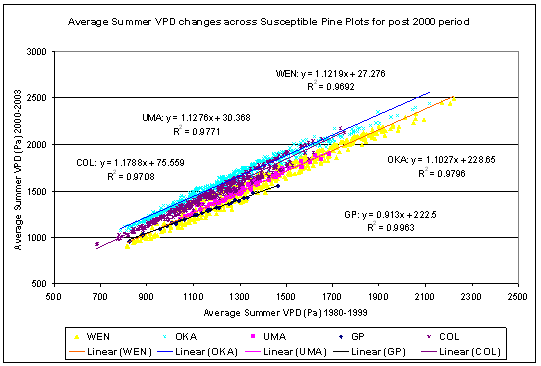 |
| Figure S.1: Average summer VPD for 1980-1999 and 2000-2003 in susceptible pine |
Using the values from Delucia et al. (2000) of approximately 0.2 m2/cm2 leaf/sapwood area (A l/A s ) for a pine that experiences an average summer VPD of 2.0 kPa, I estimated how the change in average VPD since 2000 might be expected to alter A l/A s if the 2000-2003 average VPD continues as a new equilibrium value. As Delucia et al. (2000) did not provide an equation for this relationship, I used an interpolated slope of -0.125 from their Figure 1, to calculate the estimated change in the A l/A s ratio from a permanent shift in VPD. This technique predicts a shift in the A l/A s s ratio of -0.05 m2/cm2 for the Okanogan and Colville National Forests where the bulk of the MPB outbreaks have been occurring in the past five years. Smaller shifts in the expected A l/A s ratio were predicted for other eastern Washington national forests.
The shift in the A l/A s ratio would correspond to a decline in vigor rating using many of the other rating systems for MPB. It would presumably also impact measures of GBA if the drought continued for a decade or became the new equilibrium climate pattern for the region. If Delucia et al.’s theory holds, it suggests at least two possible mechanisms that may drive enhanced disturbance cycles that are predicted under climate change scenarios. The first mechanism would be a shift in site carrying capacity. The second would be a fundamental shift in the tree’s physiological ability to react with defensive chemical responses at the time of MPB attack. These outcomes would occur because water balance mechanisms controlled by the A l/A s ratio would be fundamentally out of sync with the new climate conditions. In either case we can expect substantial declines in host vigor and concomitant increases in host susceptibility to MPB attack. More data and a greater understanding of the potential for mature pine to acclimate to shifts in average summer VPD are needed to determine the full extent and magnitude of climate induced changes to the MPB-host susceptibility interaction.
![]()
Bibliography
Agee, J. K., 1993, Fire Ecology of Pacific Northwest Forests, Washington, DC, Island Press.
Akaike, H., 1973, Information theory and an extension of the maximum likelihood principle, In: B.N. Petrov and F. Csaki, Editors, Proceedings of the 2nd International Symposium on Information Theory, Akademia Kiado, Budapest, pp. 267–281.
Alexander, Robert R. and Carleton B. Edminster, 1980, Management of ponderosa pine in even-aged stands in the Southwest. U-S-D-A-For-Serv-Res-Pap-RM-U-S-Rocky-Mt-For-Range-Exp-Stn . Fort Collins, Colo., Dec 1980. (RMRS - RP- 225) 11 p
Amman, G. D. 1972. Mountain Pine Beetle Coleoptera-Scolytidae Brood Production in Relation to Thickness of Lodgepole Pine Phloem, Journal of Economic Entomology 65:138-140
Amman, G. D., MD McGregor, DB Cahill, WH Klein, 1977, Guidelines for reducing losses of lodgepole pine to mountain pine beetle in unmanaged stands in the Rocky Mountains, USDA Forest Service, Intermountain Forest and Range Exp Stn, Ogden UT, INT-GTR-36.
Amman, G.D. and L. Safranyik, 1985, Insects of Lodgepole Pine: Impacts and Control in Baumgartner, DM et al, (eds.), Lodgepole Pine: The species and its Management, Symposium Proceedings, of the May 8-10, 1984 meeting in Spokane Washington. Washington State University, Cooperative Extension Publication, Pullman WA
Amman, G. D. ,1989, "Why partial cutting in lodgepole pine stands reduces losses to mountain pine beetle." Gen Tech Rep INT U S Dep Agric For Serv Intermt Res Stn (262): 48-59.
Amman, G. D. and Anhold, J. A., 1989, Preliminary evaluation of hazard and risk rating variables for mountain pine beetle infestations in lodgepole pine stands, pp 22-27 in Proceedings – Symposium on the management of lodgepole pine to minimize losses to the mountain pine beetle held July 12-14, 1988 in Kalispell MT, USDA FS GTR-INT-262.
Anhold, J. A., and M. J. Jenkins, 1987, Potential Mountain Pine-Beetle (Coleoptera, Scolytidae) Attack of Lodgepole Pine as Described by Stand Density Index, Environmental Entomology 16:738-742.
Ballard, R. G., M. A. Walsh, and W. E. Cole, 1984, The Penetration and Growth of Blue-Stain Fungi in the Sapwood of Lodgepole Pine Attacked by Mountain Pine-Beetle. Canadian Journal of Botany-Revue Canadienne De Botanique 62:1724-1729.
Becker, R.A., J.M. Chambers and A.R. Wilks, 1988, The New S Language: A programming Environment for Data Analysis and Graphics, AT&T Bell Laboratories, Murray Hill, NJ, 702 pp.
Bentz, B. J., G. D. Amman, and J. A. Logan, 1993, A Critical-Assessment of Risk Classification Systems for the Mountain Pine-Beetle. Forest Ecology and Management 61:349-366.
Bentz, B. J., J. A. Logan, et al., 1991, "Temperature-dependent development of the mountain pine beetle (Coleoptera:Scolytidae) and simulation of its phenology." Can Entomol 123(5): 1083-1094.
Berryman, A. A., 2002, Population regulation, emergent properties, and a requiem for density dependence. Oikos 99:600-606.
Braun, D.M. and R.I. Gara, 1990, Host Selection Behavior of the Mountain Pine Beetle in Central Washington State, unpublished report to the Washington State Department of Natural Resources, University of Washington, College Forest Resources, Seattle, WA.
Burnham, K. P., and D. R. Anderson, 2002, Model Selection and Multimodel Inference: a practical information-theoretic approach, 2nd edition. Springer-Verlag, New York.
Carroll, A. L., S. W. Taylor, et al., 2003, Effects of Climate Change on Range Expansion by the Mountain Pine Beetle in British Columbia. Mountain Pine Beetle Symposium: Challenges and Solutions. J. B. TL Shore, and JE Stone. Kelowna, BC, Natural Resources Canada, Canadian Forest Service, Pacific Forestry Centre, Information Report BC-X-399: 298 p
Chambers. J.M. and T.J. Hastie, 1992, Statistical Models in S, AT&T Bell Laboratories, Pacific Grove, CA, 608 pp
Chojnacky, D. C., B. J. Bentz, and J. A. Logan, 2000, Mountain pine beetle attack in ponderosa pine: Comparing methods for rating susceptibility - Introduction. USDA Forest Service Rocky Mountain Research Station Research Paper RMRS-RP-26
Cochran, P.H., 1992, Stocking levels and underlying assumptions for uneven-aged ponderosa pine stands, USDA Forest Service, PNW Station, Research Note #509. (PNW-RN-509, February 1992).
Cochran, 1988, Stocking Levels for Managed even-aged stands of Ponderosa Pine in Baumgartner David M. and James E. Lotan eds., Ponderosa Pine – The Species and its Management, Symposium Proceedings, Sept 29- Oct 1, 1987, Spokane WA, WSU Cooperative Extension, Pullman WA.
Cochran, P.H., 1992, Stocking Levels and Underlying Assumptions for Unevena-aged Ponderosa Pine Stands, USDA Forest Service, PNW Station, Research Note #509, PNW-RN-509, Feb 1992
Cochran, P.H., J.M. Geist, D.L, Clemens, Roderick R. Clausnitzer and David C. Powell, 1994, Suggested stocking levels for forest stands in northeastern Oregon and southeastern Washington., USDA Forest Service, PNW Station, Research Note #513, (PNW-RN-513, April 1994).
Cole, W. E. 1973, Estimating phloem thickness in lodgepole pine. USDA Forest Service, Intermountain Forest and Range Exp Stn, Ogden UT, INT-RP-148.
Cox, D. R. and N. Wermuth, 1992, "A Comment On The Coefficient Of Determination For Binary Responses." American Statistician 46(1): 1-4.
Curtis, R. O. ,1982, A Simple Index of Stand Density for Douglas-Fir. Forest Science 28:92-94.
Daly, C., 2006, "Guidelines for assessing the suitability of spatial climate data sets." International Journal of Climatology 26(6): 707-721.
Daly, C., W. P. Gibson, et al., 2002, "A knowledge-based approach to the statistical mapping of climate." Climate Research 22(2): 99-113.
Daly C, Gibson WP, Doggett M, Smith J, Taylor G., 2004, Up-to-date monthly climate maps for the conterminous United States, Proceedings of 14th AMS Conference on Applied Climatology, 84th AMS Annual Meeting Combined Preprints. American
Meteorological Society: Seattle, WA, January 13–16, 2004, Paper P5.1, http://ams.confex.com/ams/pdfpapers/71444.pdf.
Daniels, TW, JA Helms, FS Baker, 1979a, Principles of Silviculture, 2 nd Edition, New York, McGraw Hill, 500p.
DeLucia, E. H., H. Maherali, et al., 2000, "Climate-driven changes in biomass allocation in pines." Global Change Biology6(5): 587-593.
DNR, 2004, A Desirable Forest Health Program for Washington’s Forests – Forest Health Strategy Work Group Report, December 30, 2004, Washington State Department of Natural Resources, Olympia WA, 62 pp.
Fagre, D. B., D. L. Peterson, et al., 2003, "Taking the Pulse of Mountains: Ecosystem Responses to Climatic Variability." Climatic Change 59(1 - 2): 263.
Fletcher, D., D. MacKenzie and E. Villouta, 2005, Modelling skewed data with many zeros: A simple approach combining ordinary and logistic regression, Environmental and Ecological Statistics, Springer, Volume 12, Number 1, March 2005, pp. 45-54(10)
Gara, R. I., W. R. Littke, J. K. Agee, D. R. Geiszler, J. D. Stuart, and C. H. Driver, 1985., Influence of Fires, Fungi, and Mountain Pine Beetles on Development of a Lodegpole Pine Forest in South-Central Oregon. Pages 153-162 in D. M. Baumgartner, editor. Lodgepole pine - the species and its management : symposium proceedings, May 8-10, 1984 Spokane, Washington, USA and repeated May 14-16, 1984 Vancouver, British Columbia, Canada. Cooperative Extension, Washington State University, Pullman, WA.
Gedalof, Z., D. L. Peterson, et al., 2005, "Atmospheric, climatic, and ecological controls on extreme wildfire years in the northwestern United States." Ecological Applications 15(1): 154-174.
Geiszler, D. R., and R. I. Gara, 1978, Mountain Pine Beetle Attack Dynamics in Lodgepole Pine. Pages 182-187 in Theory and Practice of Mountain Pine Beetle Management in Lodgepole Pine Forests, Forest, Wildlife and Range Experiment Station, U of Idaho, Pullman, WA.
Gosz, J. R., 1992, "Gradient Analysis Of Ecological Change In Time And Space - Implications For Forest Management." Ecological Applications 2(3): 248-261.
Guisan, A., T. C. Edwards, et al., 2002, "Generalized linear and generalized additive models in studies of species distributions: setting the scene." Ecological Modelling 157(2-3): 89-100.
Hall, D. B., 2000, "Zero-inflated Poisson and binomial regression with random effects: A case study." Biometrics 56(4): 1030-1039.
Hall, Frederick C., 1987, Growth Basal Area Handbook, R6-Ecol-181b-1984, USDA FS, PNW Region
Hall, Frederick C., 1989, The concept and application of Growth Basal Area: A forestland stockability index, R6-Ecol Tech Paper 007-88, USDA FS, PNW Region
Hansen, A. J., R. R. Neilson, et al., 2001, "Global Change in Forests: Responses of Species, Communities, and Biomes." 51(9): 765.
Harmon, M. E., J. Sexton, B. A. Caldwell, and S. E. Carpenter, 1994, Fungal Sporocarp Mediated Losses of Ca, Fe, K, Mg, Mn, N, P, and Zn from Conifer Logs in the Early Stages of Decomposition. Canadian Journal of Forest Research-Revue Canadienne De Recherche Forestiere 24:1883-1893.
Helms, John A (Ed.), 1998, The Dictionary of Forestry, Society of American Foresters, Bethesda, MA, 210 pp.
Hessburg, P. F., B. G. Smith, et al., 1999, "Using Estimates of Natural Variation to Detect Ecologically Important Change in Forest Spatial Patterns: A case study, cascade range, eastern Washington." Usda Forest Service Pacific Northwest Research Station Research Paper(514): 1-+.
Hessburg, P. F., 2005, Scientist, USFS Research Laboratory, Wenatchee, WA, Personal communication, SAF meeting, Lewiston ID.
Hinckley, T. M., J. P. Lassoie, et al., 1978, "Temporal And Spatial Variations In Water Status Of Forest Trees." Forest Science 24(3): 1-72.
Hinckley, T. M. and G. A. Ritchie, 1973, "Theoretical Model For Calculation Of Xylem Sap Pressure From Climatological Data." American Midland Naturalist 90(1): 56-69.
Hurlbert, S.H., 1984, Pseudoreplication and the Design of Ecological Field Experiments, Ecological Monographs, 54(2):187-211.
Izaurralde, R. C. s., A. M. Thomson, et al., 2005, "Climate Change Impacts for the Conterminous USA: An Integrated Assessment." Climatic Change 69(1): 107.
Klinka, K. and H. Y. H. Chen, 2003, "Potential productivity of three interior subalpine forest tree species in British Columbia." Forest Ecology And Management 175(1-3): 521-530.
Kusnierczyk, E. R. and G. J. Ettl, 2002, "Growth response of ponderosa pine (Pinus ponderosa) to climate in the eastern Cascade Mountains, Washington, USA: Implications for climatic change" Ecoscience 9(4): 544-551.
Lambert, D., 1992, "Zero-Inflated Poisson Regression, With An Application To Defects In Manufacturing." Technometrics 34(1): 1-14.
Larsson, S., R. Oren, R.H. Waring and J.W. Barrett, 1983, Attacks of mountain pine beetle as related to tree vigor of ponderosa pine, Forest Science, 29(2):395-402.
Lee, A. H., K. Wang, et al.,2005, "Modelling bivariate count series with excess zeros." Mathematical Biosciences 196(2): 226-237.
Leopold, Aldo, 1966, A Sand County almanac: with essays on conservation from Round River New York : Oxford University Press.
Lillybridge, Terry R., Bernard L. Kovalchik, Clinton K. Williams, and Bradley G. Smith, 1995, Field Guide for forested plant associations of the Wenatchee National Forest, PNW-GTR-359, USDA FS Pacific Northwest Research Station
Logan, J. A. and J. A. Powell, 2001, " Ghost Forests, Global Warming, and the Mountain Pine Beetle (Coleoptera: Scolytidae)." American Entomologist 47(3): 160-172.
Logan, J. A., J. Regniere, et al., 2003, "Assessing the impacts of global warming on forest pest dynamics." Frontiers In Ecology And The Environment 1(3): 130-137.
Logan, J. A. and B. J. Bentz, 1999, "Model analysis of mountain pine beetle (Coleoptera: Scolytidae) seasonality." Environmental Entomology 28(6): 924-934.
Long, J. N. and J. D. Shaw, 2005, "A density management diagram for even-aged ponderosa pine stands." Western Journal Of Applied Forestry 20(4): 205-215.
Martin, T. G., B. A. Wintle, et al., 2005, "Zero tolerance ecology: improving ecological inference by modelling the source of zero observations." Ecology Letters 8(11): 1235-1246.
Mata SA, JM Schmid and WK Olsen, 2003, Growth of lodgepole pine stands and its relation to mountain pine beetle susceptibility, USDA Forest Service, RMRS, Res paper, RMRS-RP-42.
McCambridge, W.F., F.G. Hawksworth, C.B. Edminster and J. G. Laut, 1982, Ponderosa pine mortality resulting from a mountain pine beetle outbreak Pinus ponderosa scopularum, Dendroctonus ponderosae, relation to dwarf mistletoe infection Lory State Park, Colorado, USDA FS Research Paper 235, Rocky Mtn For and Rg Exp Stn., Fort Collins, 7 p.
McCune, B., and J.B. Grace, 2002, Analysis of ecological communities. MjM Software Design, Gleneden Beach, Oregon (available at: http://home.centurytel.net/~mjm/)
McKenzie, D, et al., 2004, "Climatic change, wildfire, and conservation." Conservation Biology 18(4): 890-902.
McKenzie, D, et al., 2003, Modelling conifer species distributions in mountain forests of Washington State, USA, The Forestry Chronicle, 79(2):253-258.
McKenzie, D., D. W. Peterson, et al., 2003, "Climatic and biophysical controls on conifer species distributions in mountain forests of Washington State, USA." Journal Of Biogeography 30(7): 1093-1108.
Mitchell, R. G., and H. K. Preisler, 1991, Analysis of Spatial Patterns of Lodgepole Pine Attacked by Outbreak Populations of the Mountain Pine-Beetle. Forest Science 37:1390-1408.
Moore, J, 2005, personal communication, Insect and Disease Aerial Mapping Specialist with Washington State Department of Natural Resources.
Oliver, W.W., 1995, Is self thinning in ponderosa pine ruled by Dendroctonus bark beetles? In Proceedings of the 1995 National Silviculture Workshop titled Forest Health through Silviculture, Rocky Mountain Gen Tech Rpt #267, USDA FS RM For and Rg Exp Stn.
Olsen, W.K., J.M. Schmid and S.A. Mata, 1996, Stand Characteristics Associated with Mountain Pine Beetle infestations in Ponderosa Pine, Forest Science 42(3):310-327.
Palmer, Michael, 1993, Putting things in even better order: the advantages of canonical correspondence analysis, Ecology, 74(8):2215-2230.
Palmer, Michael, 2004, “Ordination web site” at Oklahoma State University: http://www.okstate.edu/artsci/botany/ordinate/
Peterson D.L. and V.T. Parker (eds.), 1998, Ecological Scale, Columbia University Press, NY.
Pitman, G. B., J. P. Vite, G. W. Kinzer, and A. F. Fentiman, 1968, Bark Beetle Attractants - Trans-Verbenol Isolated from Dendroctonus. Nature 218:168-&.
Powell, David C., 1999, Suggested stocking levels for forest stands in Northeastern Oregon and Southeastern Washington: An implementation guide for the Umatilla National Forest, USDA FS Pacific Region, Umatilla National Forest, F14-SO-TP-03-99.
R Development Core Team, 2006, R: A Language and Environment for Statistical Computing. Vienna, Austria, R Foundation for Statistical Computing.
Raffa, K. F., and A. A. Berryman, 1983, The Role of Host Plant-Resistance in the Colonization Behavior and Ecology of Bark Beetles (Coleoptera, Scolytidae). Ecological Monographs 53:27-49.
Raffa, K. F., 2001, "Mixed messages across multiple trophic levels: the ecology of bark beetle chemical communication systems." Chemoecology 11(2): 49-65.
Reineke, L.H., 1933, Perfecting a stand density index for even-aged forests, J. Agric Res. 46:627-638.
Roe, AL and GD Amman, 1970, The mountain pine beetle in lodgepole pine forests, USDA Forest Service, Intermountain Forest and Range Exp Stn, Ogden UT, INT-RP-71.
Rudinsky, J. A., M. E. Morgan, L. M. Libbey, and T. B. Putnam, 1974, Antiaggregative-Rivalry Pheromone of Mountain Pine Beetle Coleoptera-Scolytidae, and a New Arrestant of Southern Pine Beetle Coleoptera-Scolytidae. Environmental Entomology 3:90-98.
Safranyik. L., 1978, Effects of Climate and Weather on Mountain Pine Beetle Populations in Theory and Practice of Mountain Pine Beetle Management: a Syposium Co-sponsored by the National Science Foundation, Washington State University, University of Idaho and the USDA Forest Service, Held in Pullman Washington April 25-27, 1978.
Sakamoto, Y., Ishiguro, M., and Kitagawa G., 1986, Akaike Information Criterion Statistics. D. Reidel Publishing Company.
Sartwell, C., 1971, Thinning ponderosa pine to prevent outbreaks of mountain pine beetle. In David M. Baumgartner (ed.) Pre-commercial thinning of coastal and intermountain forests in the Pacific Northwest, p 41-52, Washington State University Cooperative Extension Service, Pullman, WA.
Sartwell C. and Stevens, R.E., 1975, Mountain Pine Beetle in Ponderosa Pine – prospects for silvicultural control in second growth stands, Journal of Forestry, 73:136-140.
Schenk, J. A., R. L. Mahoney, J. A. Moore, and D. L. Adams, 1980, A Model for Hazard Rating Lodgepole Pine Stands for Mortality by Mountain Pine-Beetle. Forest Ecology and Management 3:57-68.
Schmid, J.M. and S.A. Mata, 1992, Stand density and mountain pine beetle caused tree mortality in ponderosa pine stands, Research Note RM 515, USDA FS RM For and Rg Exp Stn
Shore, TL, PA Boudewyn, ER Gardner, and AJ Thomson, 1989, A preliminary evaluation of hazard rating systems for the mountain pine beetle in lodgepole pine stands in British Columbia, pp 28-33 in Proceedings – Symposium on the management of lodgepole pine to minimize losses to the mountain pine beetle held July 12-14, 1988 in Kalispell MT, USDA FS GTR-INT-262.
Shore, T. L., and L. Safranyik, 1992, Susceptibility and risk rating systems for the mountain pine beetle in lodgepole pine stands. Information Report BC-X-336., Forestry Canada, Pacific Forestry Centre, Victoria, BC
Shore, T. L., L. Safranyik, and J. P. Lemieux, 2000, Susceptibility of lodgepole pine stands to the mountain pine beetle: testing of a rating system. Canadian Journal of Forest Research-Revue Canadienne De Recherche Forestiere 30:44-49
Stuart, J. D., 1984, Hazard Rating of Lodgepole Pine Stands to Mountain Pine-Beetle Outbreaks in Southcentral Oregon. Canadian Journal of Forest Research-Revue Canadienne De Recherche Forestiere 14:666-671
Thornton, PE, SW Running and MA White, 1997, Generating surfaces of daily meteorological variables over large regions of complex terrain, Journal of Hydrology, 190:214-251.
Wang, G. G. and K. Klinka, 1996, "Use of synoptic variables in predicting white spruce site index." Forest Ecology And Management 80(1-3): 95-105.
Waring, R. H., H. L. Gholz, et al., 1977, "Evaluating Stem Conducting Tissue As An Estimator Of Leaf Area In 4 Woody Angiosperms." Canadian Journal Of Botany-Revue Canadienne De Botanique 55(11): 1474-1477.
Waring, R. H., W.H. Emmingham, H.L. Gholz and C.C. Grier (1978). "Variation in Maximum Leaf Area of Coniferous Forests in Oregon and its Ecological Significance." Forest Science 24(1): 131-140.
Waring, R. H., W. G. Thies, et al., 1980, "Stem Growth Per Unit Of Leaf-Area - A Measure Of Tree Vigor." Forest Science 26(1): 112-117.
Waring, R. H., P. E. Schroeder, et al., 1982, "Application Of The Pipe Model-Theory To Predict Canopy Leaf-Area." Canadian Journal Of Forest Research-Revue Canadienne De Recherche Forestiere 12(3): 556-560.
Waring, R. H., K. Newman, et al., 1981, "Efficiency Of Tree Crowns And Stemwood Production At Different Canopy Leaf Densities." Forestry 54(2): 126-137.
Waring, R. H. and G. B. Pitman, 1983, "Physiological Stress in Lodgepole Pine as a Precursor for Mountain Pine-Beetle Attack." Zeitschrift Fur Angewandte Entomologie-Journal of Applied Entomology96(3): 265-270.
Waring, R. H., 1983, "Estimating Forest Growth And Efficiency In Relation To Canopy Leaf-Area." Advances In Ecological Research 13: 327-354.
Waring, R. H., 1985, "Imbalanced Forest Ecosystems - Assessments And Consequences." Forest Ecology And Management 12(2): 93-112.
Waring, R. H. and G. B. Pitman, 1985, "Modifying Lodgepole Pine Stands to Change Susceptibility to Mountain Pine-Beetle Attack." Ecology 66(3): 889-897.
Waring, R. H. and W. H. Schlesinger, 1985, Forest Ecosystems: Concepts and Management. Orlando, FL, Academic Press Inc.
Waring, R. H. and B. E. Law, 2001, "The ponderosa pine ecosystem and environmental stress: Past, present and future." Tree Physiology 21(5): 273-274.
Warton, D. I., 2005, "Many zeros does not mean zero inflation: comparing the goodness-of-fit of parametric models to multivariate abundance data." Environmetrics 16(3): 275-289.
Welsh, A. H., R. B. Cunningham, et al., 1996, "Modelling the abundance of rare species: Statistical models for counts with extra zeros." Ecological Modelling 88(1-3): 297-308.
Wilkens, R.T., M.P. Ayres, P.L. Lorio Jr., and J.D. Hodges, 1998, Environmental Effects on Pine Tree Carbon Budgets and Resistance to Bark Beetles, pp 591-616 in The Productivity and Sustainability of Southern Forest Ecosystems in a Changing Environment, R.A. Minckler and S. Fox (eds), New York, NY, Springer-Verlag.
Williams, Clinton K., and Terry R. Lillybridge, 1983, Forested Plant Associations of the Okanogan National Forest, USDA Forest Service, Pacific Northwest Research Station, R6-Ecol-132b-1983.
Williams, Clinton K., Brian F. Kelley, Bradley G. Smith, and Terry R. Lillybridge, 1995, Forested Plant Associations of the Colville National Forest, USDA Forest Service, Pacific Northwest Research Station, Gen Tech Rpt., PNW-GTR-360.
Wykoff, William R., Nicholas L. Crookston and Albert Stage, 1982, User’s Guide to the Stand Prognosis Model, USDA Forest Service, Intermountain Forest and Range Experiment Station, Ogden UT, Gen Tech Report, INT-GTR-133, 113 pp.
Yeh, Hui-Yi and Lee C. Wensel, 2000, The relationship between tree diameter growth and climate for coniferous species in northern California, Can. J. For. Res./Rev. can. rech. for. 30(9): 1463-1471
![]()
Vita
Elaine Oneil earned a Bachelor of Science in Forestry from the University of British Columbia in 1989 and a Master of Science from the University of Washington in 2003. In 2006 Elaine earned a Doctor of Philosophy at the University of Washington in Silviculture. Elaine is also a Registered Professional Forester in British Columbia and a member of the Society of American Foresters.


