Determining the opportunity cost and pricing mechanism to produce ecosystem services measured by definable metrics such as habitat suitability or DFC is practical. Some managers may prefer the Biodiversity Pathway as serving their personal values and objectives; some may need greater compensation and prefer a nearer-term payout; others may prefer an annual compensation to alleviate the risk of changing market conditions. If the production of habitat was open to competitive bidding some would be willing to receive less than others for the opportunity.
There are many treatment alternatives to produce old forest structures or species-specific habitat. Young forest habitat will also be improved, as a result of the early thinnings associated with the Biodiversity Pathway. In cases where regulatory requirements or voluntary standards have placed lands into a no-management status, it should be noted that delivery of an ecosystem service might be more efficient using a biodiversity pathway, both enhancing habitat and improving economic returns. This may be sufficient incentive to sustain the land in forestry. For example, thinning to produce the structures in vicinities that owls have previously used for nests may be considerably more effective than no-management reserves that do not meet DFC conditions.
Introduction:
Most threatened species are those that require old forest structures for their habitat. Long rotations remain dense for such a long period of time that they are very costly and inefficient in reaching old forest conditions quickly. The Washington Forest Landscape Management Project found that the best treatments for restoring old forest habitat involved periodic thinnings over longer rotations including consideration for understory and log retention (Carey et al 1996 and 1999). Long rotations and thinning treatments to produce older forest structures do result in a substantial revenue loss to landowners so it was expected such treatments would require incentive compensation in order to keep the lands sustainably managed for habitat objectives. These early studies generally resulted in an opportunity cost of roughly $2000 per treated acre at the time of the first thinning, a 30-40% reduction in earning potential with much of the loss from the long rotation offset by the higher value of larger logs after the first thinning treatment (Lippke et al. 1996). However in recent years the premium for large logs has disappeared as a consequence of the declining volume of such logs and their processing infrastructure as well as improvements in small log processing along with increased use of engineered products that have displaced much of the need for larger logs.
Thinning treatments were shown to be much better than just long rotations as they both reduced the time necessary for the stand to take on old forest attributes and they provided revenue to the landowner. Commercially regenerated forests begin with much higher densities than the more sporadic regeneration after natural disturbances generally associated with existing old forests (Bailey and Tappeiner 1998). An achievement of commercial forest managers has been to double and triple the yield from a managed plantation over that of natural regeneration. As a consequence regenerated stands are much denser than natural forests and take a very long time for sufficient mortality to reach old forest like structures. The treatments to periodically thin stands to achieve higher biodiversity with structures similar to old forests while at the same time at least reducing the cost relative to no action alternatives became known as biodiversity management pathways.


Opportunity Cost of Biodiversity Management Pathway:
A useful metric for measuring the effectiveness for producing old forest habitat is the percent of time the stand structure is statistically similar to an old forest as the Desired Future Condition (DFC). Old forests are generally characterized by large diameters and height and reduced trees per acre with canopy beginning to open from mortality. A commercial rotation will likely produce 0% time in DFC over a 45 year rotation while a biodiversity pathway may equate to DFC conditions 50% of the time in 100 years. Other metrics such as species specific habitat suitability indices have also been developed although involving a more complex multi-species set of tradeoffs for evaluation.
The preferred economic metric for sustainable management of commercial forests is the bare land value one could afford to pay for commercial forestry known as the soil expectation value (SEV). SEV is the present value of all future incomes and costs discounted to the present i.e. the time of the regeneration investment with the discount rate set to the owners target rate of return. A harvest value of about $12,000/acre on a 45 year rotation (medium site class) produces an SEV of about $1000 per acre, the price one could afford to pay for the land. The difference in SEV from commercial management to that available from a biodiversity pathway or thinning becomes the cost to the landowner for producing old forest habitat known as the opportunity cost that would need to be provided as compensation for the production of habitat as an ecosystem service.
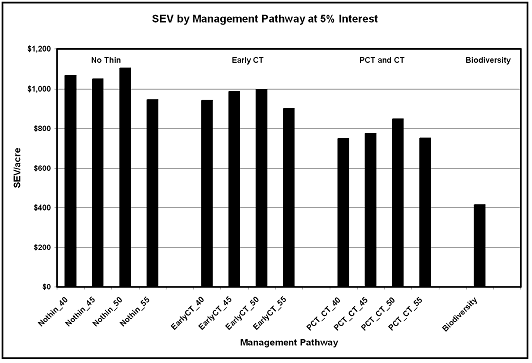
The figure below shows the SEV for a range of commercial treatments compared to a biodiversity pathway thinned to 180tpa at age 20, 75 tpa at age 50 and 35tpa at age 70 with a rotational final harvest at age 100. The $1100 SEV for the optimal commercial rotation for a 5% discount rate (adjusted for inflation) compares to $415 SEV for the biodiversity pathway. For the landowner to be indifferent whether to manage for commercial timber returns or to support better habitat on such a biodiversity pathway they should receive an annual payment at time of regeneration of 5% of $(1100-415=685) or $34 per year adjusted for inflation. This computation would vary by site class and could be customized for best habitat performance for specific species that may be in short supply. The result is also sensitive to the choice of a discount rate. However at a 6% rate the SEV and opportunity cost are both much less such that the annual payment is reduced but not by a large percentage. A 5% discount rate adjusted for inflation is a respectable return falling slightly below long-term stock market returns which have generally been considered of higher risk to default compared to a natural disturbance impacts on the forest. However the regulatory risk impact on forests has increased substantially in recent years as has the impact of international competition. While stock market returns appeared to be high in 2002, there has been no real return to the S&P 500 in the last decade i.e. the stock market is risky and subject to long market cycles.
Valuing the opportunity cost of a biodiversity pathway at the time of the first thinning is a practical option as it corresponds to the time at which the course for the rest of the management pathway is set. The $34 payment for the 20 years prior to the first thinning is worth $1125 per acre (adjusted for inflation) as the one time payment at age 20 required to catch up for lost annual payments for the first 20 years at which time the $34 annual payment would need to resume. If the first thinning is at age 30 the lost payments would be worth $2256 at age 30 at the time annual payments would need to be provided.
Some managers may prefer the Biopathway as serving some of their own personal values and objectives; some may need greater compensation preferring a nearer term payout; others may prefer the annual compensation to the risk of changing market conditions. If the production of habitat was open to competitive bidding some would be more willing than others to bid for the opportunity. Determining the opportunity cost to produce an ecosystem service measured by definable metrics such as habitat suitability or DFC is practical and is not a problem in contrast with knowing what the ecosystem service is worth to various publics or how it may be valued by individual forest landowners. Both the efficiency of economics and habitat production will be somewhat site specific with high site stands being able to produce better habitat conditions faster, but at a higher opportunity cost as more commercial return is lost.
In terms of scale, 1 million acres devoted to biodiversity pathways would result in 500,000 acres generally in a moving mosaic of old forest structures or species specific habitat with an opportunity cost or incentive payment of $34 million per year starting with the initiation of the program. Starting the program at the first thinning, age 20, would require a one time payment of $1.1 billion to reach the target forest structure 20 years earlier with continuing annual payments of $34 million/yr thereafter.
Treatment Alternatives:
There are many treatment alternatives to produce old forest structure or species specific habitat and customized treatments could substantially lower the cost for some habitat. There would also be an improvement in young forest habitat associated with any biodiversity pathway as a result of the early thinnings but this can also be provided at the very low marginal cost demonstrated by the short rotation thinning alternatives to the no thin alternatives shown below.
There are also improvements taking place in commercial forestry that raise the SEV for commercial treatments thereby increasing the opportunity cost of biodiversity management pathways. Experimental plots with the Stand Management Coop show that properly applied vegetation control can nearly double the rate of growth for the first 20 years by reducing competition in the first few years resulting in shorter rotations and as much as a doubling in SEV which would more than double the opportunity cost of biodiversity pathway comparisons.
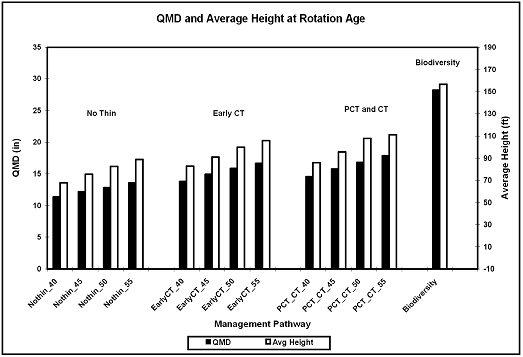
Figures 2 and 4 below from Discussion Paper 2 in the Future of Washington’s Forest and Forest Industries report to the Legislature (CFR 2007) provides SEV and tree structure comparisons across several management alternatives including comparisons between the no thin 50 year rotation which provided the best economics and the biodiversity pathway which provided a cost-effective old forest structure.


 |
Figure 2: Soil expectation value (SEV) for different management pathways at 5% interest. The optimal rotation length at this interest rate is 50 years.
|
 |
Figure 4: Quadratic mean diameter (QMD) and average height across different management pathways. Thinning and longer rotations result in greater average tree size. The biodiversity pathway results in significantly larger trees.
|
References:
Bailey, J.D. and J.C. Tappeiner. 1998. Effects of thinning on structural development in 40- to100-year-old Douglas-fir stands in western Oregon. Forest Ecology and Management 108:99-113.
Carey, Andrew, Bruce Lippke, John Sessions. 1999. Intentional Ecosystem Management: Managing Forests for Biodiversity. Journal of Sustainable Forestry Vol. 9.
Carey, Andrew B., C. Elliott, B.R. Lippke, et al. 1996. Washington Forest Landscape Management Project—A Pragmatic, Ecological Approach to Small-Landscape Management. Washington State Dept. of Natural Resources. Olympia, WA.
CFR, 2007. Future of Washington’s Forests and Forest Industries. Final Report prepared by the College of Forest Resources for DNR and the Washington State Legislature. Study 1: Timber Supply and Forest Structure Lippke, Bruce, Larry Mason, Kevin Zobrist, Kevin Ceder, Elaine Oneil, Jim McCarter, Hiroo Imaki, Alicia Sullivan. University of Washington, Seattle Washington. 125 pp plus 13 Discussion Papers of 191 pp (Full report 518 pp).
Lippke, Bruce R., J. Sessions, A. B. Carey. 1996. Economic Analysis of Forest Landscape Management Alternatives: Final report of the working group on the economic analysis of forest landscape management alternatives for the Washington Forest Landscape Management Project. Special Paper 21, CINTRAFOR, College of Forest Resources, Univ. of Washington, Seattle, WA. 157 pp.

|


