The current regulations in Western WA, known
as the Forests and Fish Rules (FFR), require a three-zone
riparian harvest buffer along either side of any fish-bearing
stream. The total combined buffer width is one site potential
tree height (SPTH), which is 90-200 feet depending on site
quality. The zone adjacent to the stream is a 50’ no-harvest
core zone. This is followed by the inner zone, in which two
partial harvest options are allowed. Option 1 allows the
smallest trees to be removed such that a minimum of the 57
largest trees per acre (TPA) are left. Option 2 allows the
trees furthest from the stream to be removed up to a minimum
distance of 80’ from the stream. The final zone is
the outer zone, in which partial harvest is allowed such
that 20 conifers per acre larger than 12” in diameter
are retained.
In Western OR, riparian timber harvest is regulated by the
1994 Forest Practices Act (FPA), which requires riparian buffers
of 50’, 70’, or 100’ in width for small,
medium, and large fish-bearing streams respectively, as defined
by average annual flow thresholds. No harvest is allowed within
20’ of the stream. For the remainder of the buffer, sufficient
conifers must be retained such that targets for minimum total
tree count and/or basal area (BA) are met. Leave tree targets
are determined by stream size and geographic location. OR also
has the 1997 OR Plan for Salmon and Watersheds, which encourages
landowners to voluntarily minimize harvest activities in riparian
areas by taking no more than 25% of the BA in excess of the
minimum leave target defined by the FPA.
The Westside rules in both WA and OR have similar goals: to
put the development of riparian stands on a trajectory toward
a desired future condition (DFC) of mature forest structure
intended to provide high quality riparian habitat. The WA rules
define DFC as “the stand conditions of a mature riparian
forest at 140 years of age” (WAC 222-16-010). Similarly,
the OR rules define DFC as “unmanaged mature streamside
stands” at 120 years of age (OAR 629-640-000). Despite
these similarities between the regulatory goals in WA and OR,
the riparian prescriptions for meeting these goals are very
different. The differences are particularly evident for small
streams. Using an example of a small stream and site class
II, the total buffer width would be 170’ in WA compared
to 50’ in OR. Assuming Option 2 in WA, the no-harvest
portion of the buffer would be 80’, compared to 20’ in
OR. For the remainder of the buffer, WA requires 20 TPA, which
would be 26 trees per 1000’ of stream. For the remainder
of the OR buffer, only the trees needed to achieve a total
BA of 40 ft2/1000’ of stream must be retained. In many
cases this target can be met or exceeded within the 20’ no
harvest zone.


Management simulations of the WA and OR riparian
regulations were done for ten case studies of Westside
small forest ownerships that ranged in size from 33 to
318 acres and included varying proportions of riparian
to upland acreage with a variety of timber species and
age classes. The management simulations were done using
Geographical Information Systems (GIS) technology and the
Landscape Management System (LMS). Five scenarios were
simulated for each forest data set: minimum OR FPA requirements,
OR Plan, OR Full Buffer (no harvest within the riparian
zone), minimum WA FFR requirements, and WA Full Buffer.
For each scenario, the economic losses from the riparian
harvest restrictions were assessed in terms of both the
loss in forest value (FV) and soil expectation value (SEV).
FV is the total value of a forest as an economic asset,
including both land and existing timber. Losses in FV represent
the total cost of riparian protection as a proportion of
the total asset value of the property. SEV, also known
as bare land value, is the economic value of the land by
itself when used for forest management. Losses in SEV reflect
a decrease in the competitiveness of forestry as a land
use investment relative to other alternatives. SEV is thus
an important overall indicator of long-term economic viability.
The analysis of FV and SEV assumed a real target rate of
return of 5%.
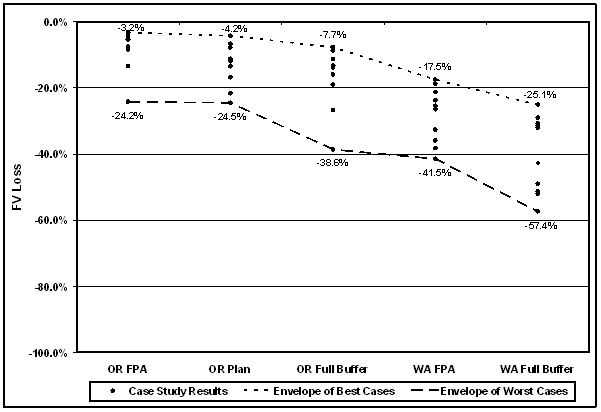
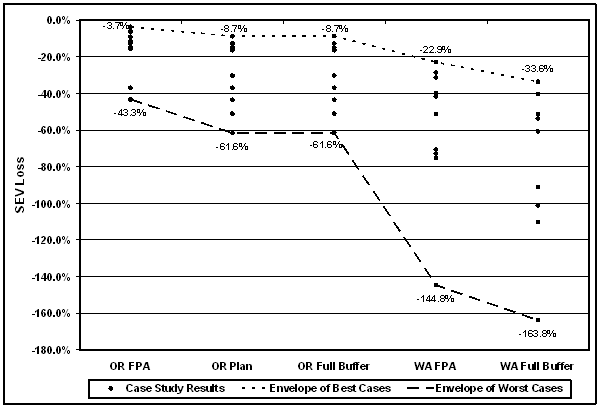
Figures 1 and 2 plot the FV and SEV losses respectively
for the ten case studies under each of the five scenarios.
The OR FPA simulations resulted in the least economic costs,
with losses ranging from 3.2% to 24.2%. The higher impact
case studies were those with large streams, which have
wider buffers and higher retention requirements. The OR
Plan resulted in a small increase in costs above OR FPA.
FV losses were lower under the OR Plan compared to the
OR Full Buffer as some mature timber was harvested from
the riparian area under the OR Plan approach. SEV losses
were the same under both scenarios, though, as not enough
timber is removed under the OR Plan to utilize the land
for additional rotations. The case study results for the
WA FFR show economic impacts greater than OR Full Buffer.
The WA Full Buffer simulations showed the most substantial
impacts, with considerable value reductions in both FV
and SEV for all case studies.
In both states, impacts to SEV were greater than impacts
to FV. This is not unexpected, as the economic performance
of new investments in forest rotations will be more sensitive
to decreases in future revenue compared to existing timber
for which establishment costs are sunk. SEV impacts are
particularly high for the WA simulations because of the
wider no-harvest areas. While WA does offer a program to
partially compensate for the value of riparian leave trees,
funding is only available to meet a small percentage of
the potential need, and the program does not improve SEV,
the important measure of long-term viability (see Fact
Sheet #2). Costs of the magnitude displayed in many of
the simulations for both WA and OR may increase the attractiveness
of forestland conversion.
Many of the stands included in these case studies are young,
dense plantations, which are typical of managed forest
conditions throughout Western WA and OR. Thinning in the
riparian portions of these stands is either not permitted
or not economically attractive under the regulations, since
investments in early thinnings will not be recovered by
subsequent harvests. An absence of thinning in these young,
overstocked stands is known to delay or even preclude the
achievement of mature forest conditions with large diameter
trees (see Fact Sheet #24).


 |
| Figure 1: Losses in forest value (FV)
from OR and WA riparian regulations. |
 |
| Figure 2: Losses in soil expectation value (SEV)
from OR and WA riparian regulations. |


WA
and OR policymakers anticipated that there could be economic
and environmental problems with inflexible buffer regulations.
The regulations in both states encourage landowners in
these situations to pursue alternate plans (RCW 76.13.110
and OAR 629-640-000), site-specific management strategies
for improving riparian habitat at a lower cost. The WA
regulations further suggest “templates” of
established guidelines to facilitate alternate plan implementation
for common situations like overstocked stands. RTI has
developed two example templates for overstocked stand on
site class II (see Fact Sheet #23 for details). These templates
utilize lengthened rotations with successive biodiversity
thinnings to add structural complexity to the riparian
zone while still maintaining economic viability.
Looking at the area within 170 feet of a small stream for
an example 20-year-old plantation, Table 1 shows comparative
results for the WA and OR regulatory scenarios and the
two example alternate plans. The comparison measures the
predicted percentage of time for each scenario simulation
over the next 140 years that the resulting riparian stand
structure will be statistically similar to the DFC using
the RTI targeting and assessment procedure (see Fact Sheet
#6). The comparison also shows the economic costs in terms
of FV and SEV within this 170’ zone, and the DFC/cost
ratio for both FV and SEV.
Table 1: Comparison of DFC and costs between
the OR and WA regulations and two alternate plan examples
| Scenario |
% Time
in DFC |
FV
Cost |
SEV
Cost |
DFC/FV
Cost |
DFC/SEV
Cost |
| OR FPA |
41.30% |
15% |
27% |
2.7 |
1.54 |
| WA FFR |
32.10% |
70% |
134% |
0.46 |
0.24 |
| Alt A |
70.10% |
29% |
67% |
2.44 |
1.05 |
| Alt B |
64.90% |
22% |
67% |
2.89 |
0.97 |
Table 1 shows that higher costs do not necessarily
correlate with greater similarity to DFC. The WA regulations,
with a wide application of a no-action prescription, achieve
the lowest levels of DFC and also have the highest costs,
resulting in very low DFC/cost ratios. The OR regulations
apply the no-action prescription to a much narrower area,
which lowers costs and achieves slightly higher levels
of DFC, resulting from the latter years of the commercial
rotations applied to the remainder of the riparian zone.
Because these commercial rotations are relatively short,
the overall level of DFC over 140 years is still quite
limited, though the DFC/cost ratios are high because of
the low costs. The two alternate plan examples provide
a much higher level of DFC, suggesting that extended rotations
with biodiversity thinnings can achieve DFC sooner and
maintain DFC longer. The costs for these alternate plans
are comparatively low, resulting in DFC/cost ratios that
are comparable to the OR regulations but with greater achievement
of DFC. This suggests that alternate plans are an important
feature of the regulations in both states for achieving
desired habitat conditions at a lower risk to the economic
viability of small forest ownerships.

|


